

Question: I need part D and E only to be solved The following data represents number of customers arriving at Quick Lube for an oil change
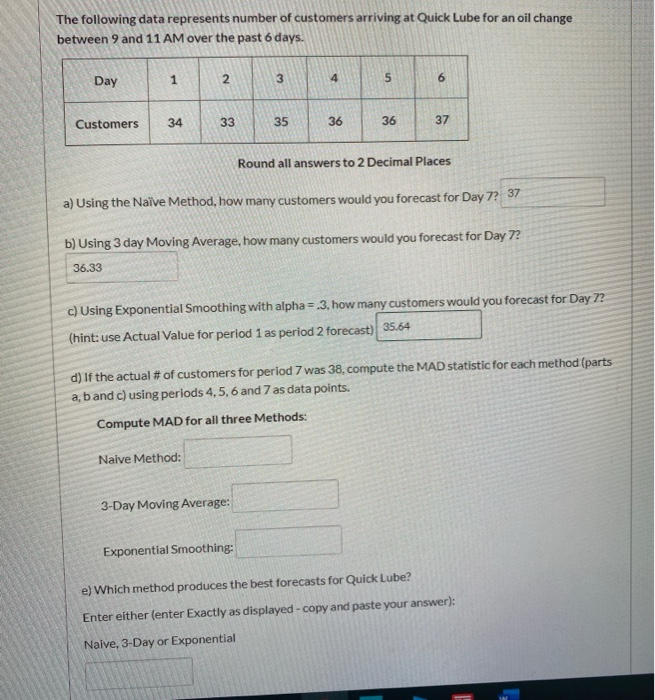
I need part D and E only to be solved
Step by Step Solution
There are 3 Steps involved in it
1 Expert Approved Answer
Step: 1 Unlock

Question Has Been Solved by an Expert!
Get step-by-step solutions from verified subject matter experts
Step: 2 Unlock
Step: 3 Unlock