

Question: I need solve this question MCQ of Code course managerial statistics Question 3 Answer saved Marked out of 2.00 Flag question When constructing a pie
I need solve this question MCQ of Code course managerial statistics
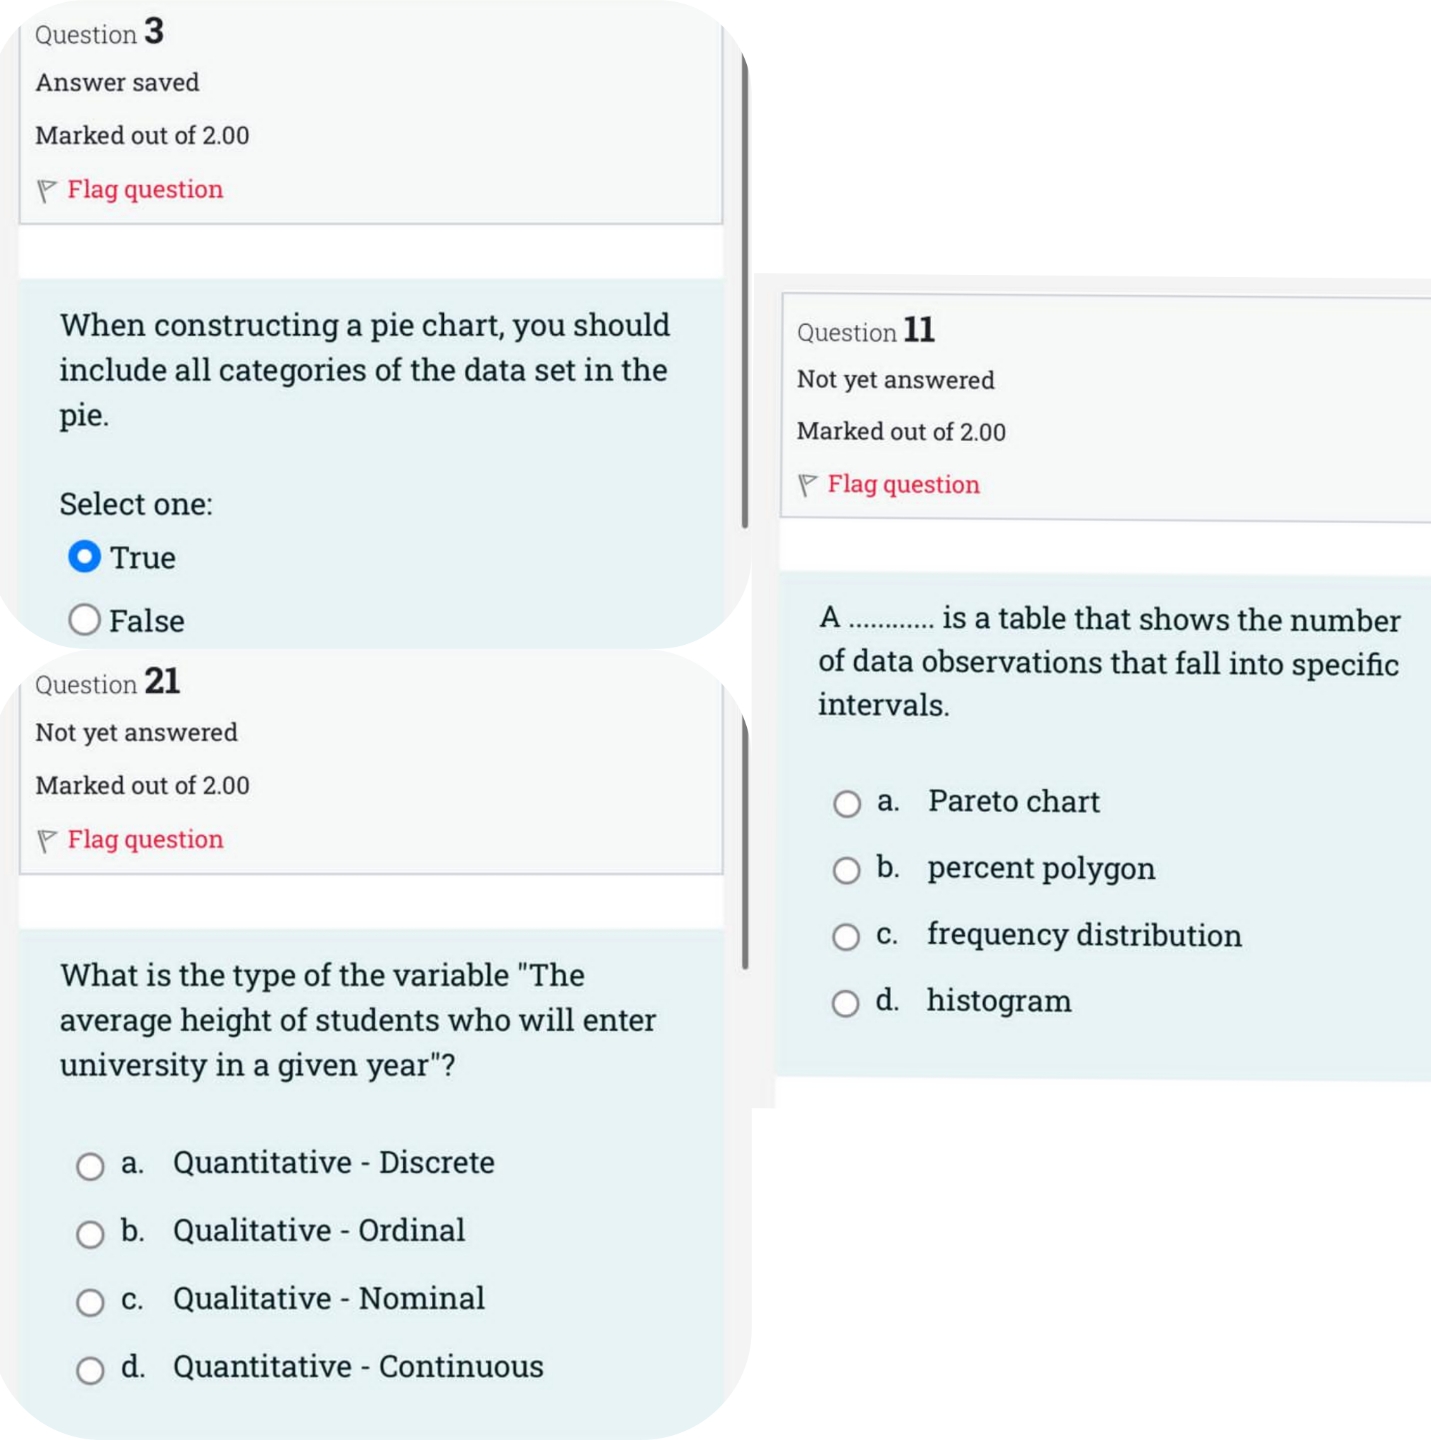
Question 3 Answer saved Marked out of 2.00 Flag question When constructing a pie chart, you should Question 11 include all categories of the data set in the Not yet answered pie. Marked out of 2.00 Select one: Flag question O True O False A ........ is a table that shows the number Question 21 of data observations that fall into specific intervals. Not yet answered Marked out of 2.00 O a. Pareto chart Flag question O b. percent polygon O c. frequency distribution What is the type of the variable "The average height of students who will enter O d. histogram university in a given year"? O a. Quantitative - Discrete O b. Qualitative - Ordinal O c. Qualitative - Nominal O d. Quantitative - Continuous
Step by Step Solution
There are 3 Steps involved in it

Get step-by-step solutions from verified subject matter experts