

Question: i need some help figuring out how to do the question below. Anabelle collected data on the favorite superhero of the students in her class.
i need some help figuring out how to do the question below.
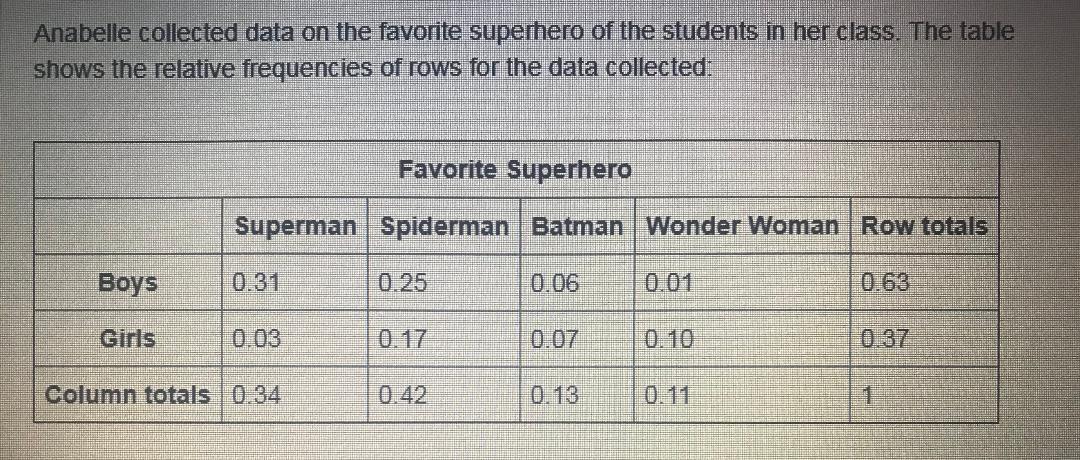
Anabelle collected data on the favorite superhero of the students in her class. The table shows the relative frequencies of rows for the data collected Favorite Superhero Superman Spiderman Batman |Wonder Woman | Row totals Boys 0.31 0.25 0.06 0.01 0.63 Girls 0.03 0. 17 0.07 0. 10 0.37 Column totals 0.34 0.42 0.13 0.11 1
Step by Step Solution
There are 3 Steps involved in it
1 Expert Approved Answer
Step: 1 Unlock

Question Has Been Solved by an Expert!
Get step-by-step solutions from verified subject matter experts
Step: 2 Unlock
Step: 3 Unlock