

Question: i need some help please Data Sheet A. An experiment test of Boyle's law: Complete the table 1. Atmospheric pressure =752.3mm Hg B. Plot three
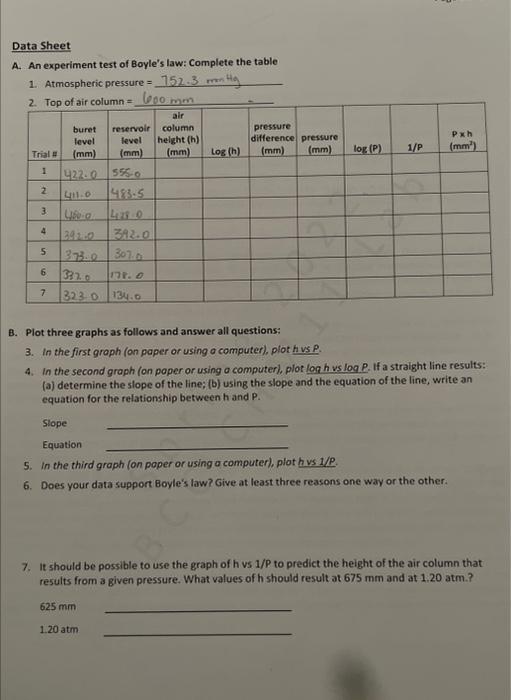
Data Sheet A. An experiment test of Boyle's law: Complete the table 1. Atmospheric pressure =752.3mm Hg B. Plot three graphs as follows and answer all questions: 3. In the first graph (on paper or using o computef), plot h vs P. 4. In the second graph (on poper or using a computer), plor log h vs log P. If a straight line results: (a) determine the slope of the line; (b) using the slope and the equation of the line; write an equation for the relationship between h and P. Slope Equation 5. In the third graph (on poper or using a computer), plot hus 1/P. 6. Does your data support Boyle's law? Give at least three reasons one way or the other. 7. It should be possible to use the graph of h v 1/P to predict the height of the air column that results from a given pressure. What values of h should result at 675mm and at 1.20atm.? 625mm 1.20atm
Step by Step Solution
There are 3 Steps involved in it

Get step-by-step solutions from verified subject matter experts