

Question: I need some help with how to do the formulas for the following Ratios. It is just for the current year 2021 of financial records.
I need some help with how to do the formulas for the following Ratios. It is just for the current year 2021 of financial records.
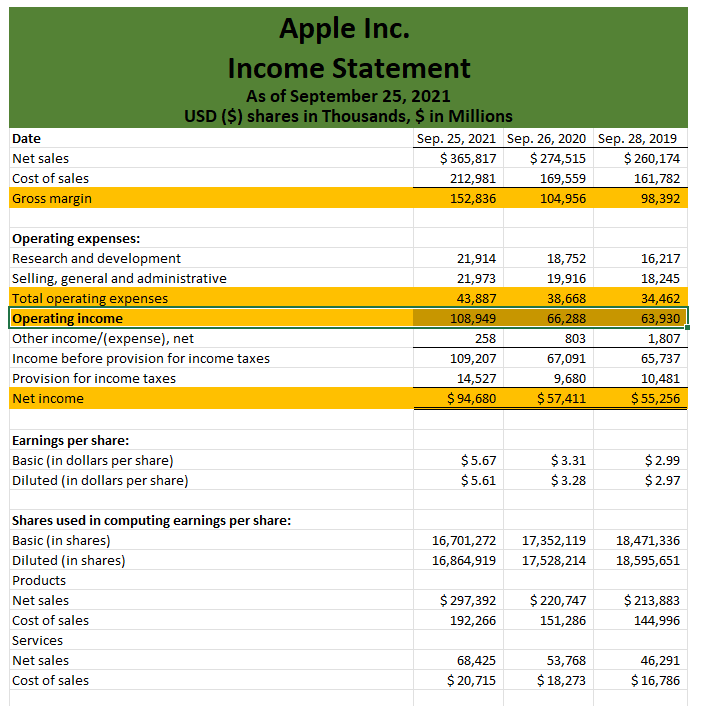
The list of ratios to be included are as follows. They should be grouped under the headings, as shown: Liquidity Ratios o Current Ratio o Quick Ratio Leverage Ratios o Debt to Total Assets Ratio o Debt Equity Ratio o Long-Term Debt to Equity o Times Interest Earned Ratio Activity Ratios o Inventory Turnover o Fixed Assets Turnover o Total Assets Turnover o Accounts Receivable Turnover o Average Collection Period Profitability Ratios o Gross Profit Margin o Operating Profit Margin o Net Profit Margin o Return on Total Assets (ROA) o Return on Stockholders Equity (ROE) o Earnings Per Share (EPS) o Price Earnings Ratio Calculate the ratios for your chosen company for the last three years, linking the ratio calculations back to the historical financial statement tabs (Tabs 2- 4) using formulas.
ACCT 370 Page 3 of 4 Calculate the ratios for each of your companys competitors (most recent year only), linking the ratio calculations to the competitor financial statements shown in Tabs 5-10 using formulas. Using the internet, locate the industry averages for the ratios listed above, and include them in the final column of the ratio tab. Include a footnote on the tab to identify the source of the industry averages.
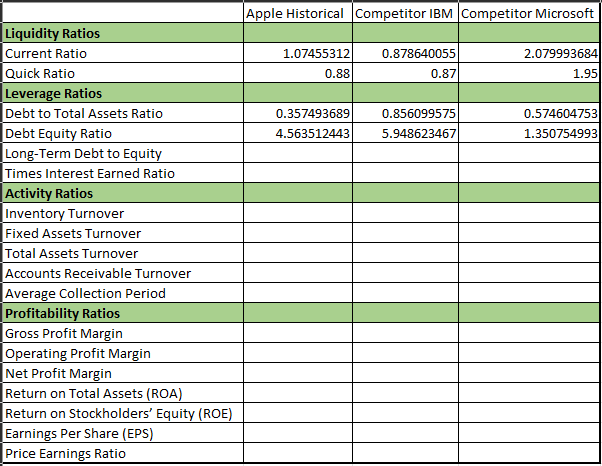
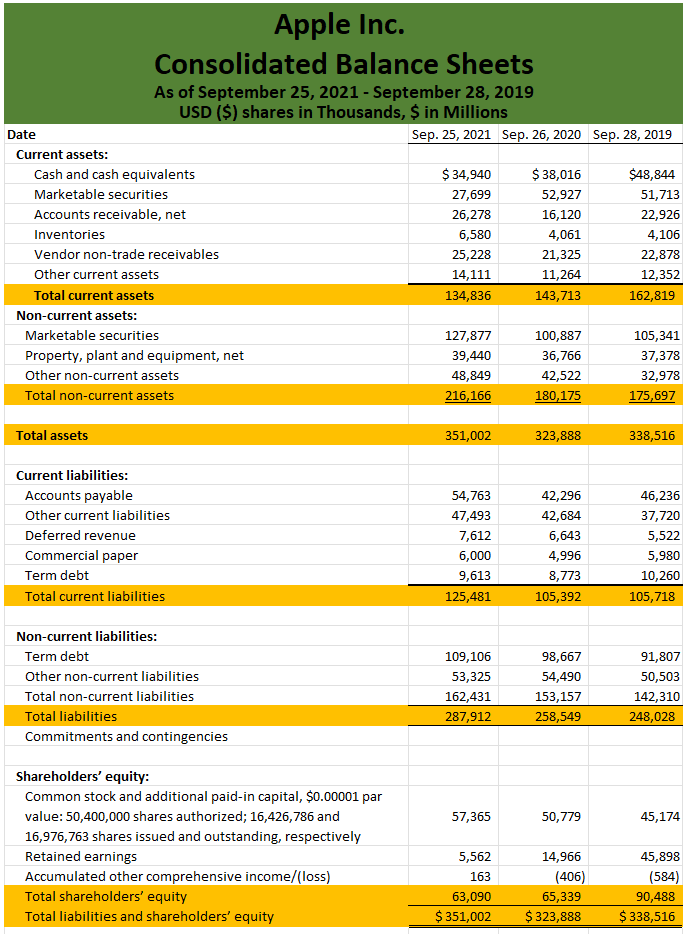
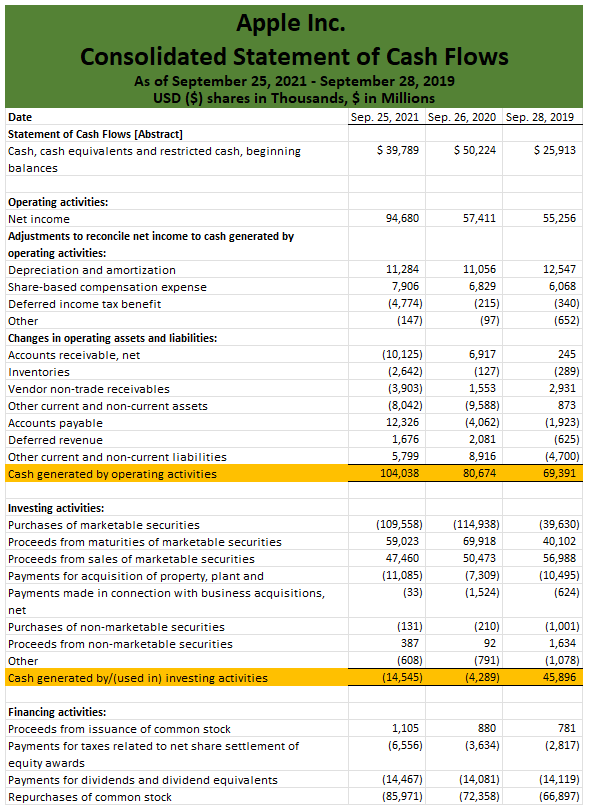
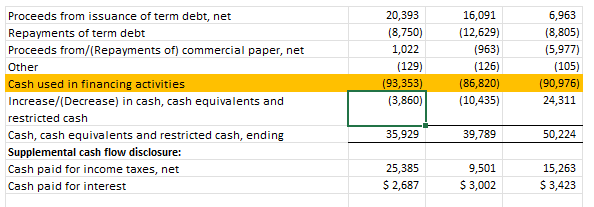
\begin{tabular}{|l|r|r|r|} \hline & Apple Historical & Competitor IBM & Competitor Microsoft \\ \hline Liquidity Ratios & & & \\ \hline Current Ratio & 1.07455312 & 0.878640055 & 2.079993684 \\ \hline Quick Ratio & 0.88 & 0.87 & 1.95 \\ \hline Leverage Ratios & & & \\ \hline Debt to Total Assets Ratio & 0.357493689 & 0.856099575 & 0.574604753 \\ \hline Debt Equity Ratio & 4.563512443 & 5.948623467 & 1.350754993 \\ \hline Long-Term Debt to Equity & & & \\ \hline Times Interest Earned Ratio & & & \\ \hline Activity Ratios & & & \\ \hline Inventory Turnover & & & \\ \hline Fixed Assets Turnover & & & \\ \hline Total Assets Turnover & & & \\ \hline Accounts Receivable Turnover & & & \\ \hline Average Collection Period & & & \\ \hline Profitability Ratios & & & \\ \hline Gross Profit Margin & & & \\ \hline Operating Profit Margin & & & \\ \hline Net Profit Margin & & & \\ \hline Return on Total Assets (ROA) & & & \\ \hline Return on Stockholders' Equity (ROE) & & & \\ \hline Earnings Per Share (EPS) & & & \\ \hline Price Earnings Ratio & & & \\ \hline \end{tabular} Apple Inc. Consolidated Balance Sheets As of September 25, 2021 - September 28, 2019 USD (\$) shares in Thousands, $ in Millions Apple Inc. Consolidated Statement of Cash Flows As of September 25, 2021 - September 28, 2019 USD (\$) shares in Thousands, \$ in Millions \begin{tabular}{|l|r|r|r|r|} \hline Proceeds from issuance of term debt, net & 20,393 & 16,091 & 6,963 \\ \hline Repayments of term debt & (8,750) & (12,629) & (8,805) \\ \hline Proceeds from/(Repayments of) commercial paper, net & 1,022 & (963) & (5,977) \\ \hline Other & (129) & (126) & (105) \\ \hline Cash used in financing activities & (93,353) & (86,820) & (90,976) \\ \hline Increase/(Decrease) in cash, cash equivalents and & (3,860) & (10,435) & 24,311 \\ \hline restricted cash & & \\ \hline Cash, cash equivalents and restricted cash, ending & 35,929 & 39,789 & 50,224 \\ \hline Supplemental cash flow disclosure: & & \\ \hline Cash paid for income taxes, net & 25,385 & 9,501 & 15,263 \\ \hline Cash paid for interest & $2,687 & $3,002 & $3,423 \\ \hline \end{tabular}
Step by Step Solution
There are 3 Steps involved in it

Get step-by-step solutions from verified subject matter experts