

Question: I need some help with the t-values and p-values. I have run it in SPSS and Excel but get different results for each program. >Compute
I need some help with the t-values and p-values. I have run it in SPSS and Excel but get different results for each program.
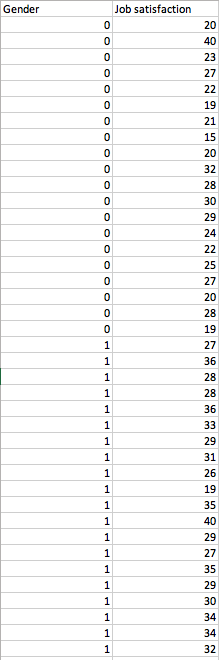
>Compute an independent sample t test on these data. Report descriptive statistics (Mean and Standard deviation), t values, and p values.
>Create a graph to show the differences between the two groups.
>Write a Results section based on your analysis. Interpret results of the independent sample t test to answer the research question and the hypothesis.
Step by Step Solution
There are 3 Steps involved in it
1 Expert Approved Answer
Step: 1 Unlock

Question Has Been Solved by an Expert!
Get step-by-step solutions from verified subject matter experts
Step: 2 Unlock
Step: 3 Unlock