Question: I need some help with this simulation! I need to increase EPS and all other variables to get to investor expectations and exceed them. HEgov
I need some help with this simulation! I need to increase EPS and all other variables to get to investor expectations and exceed them.
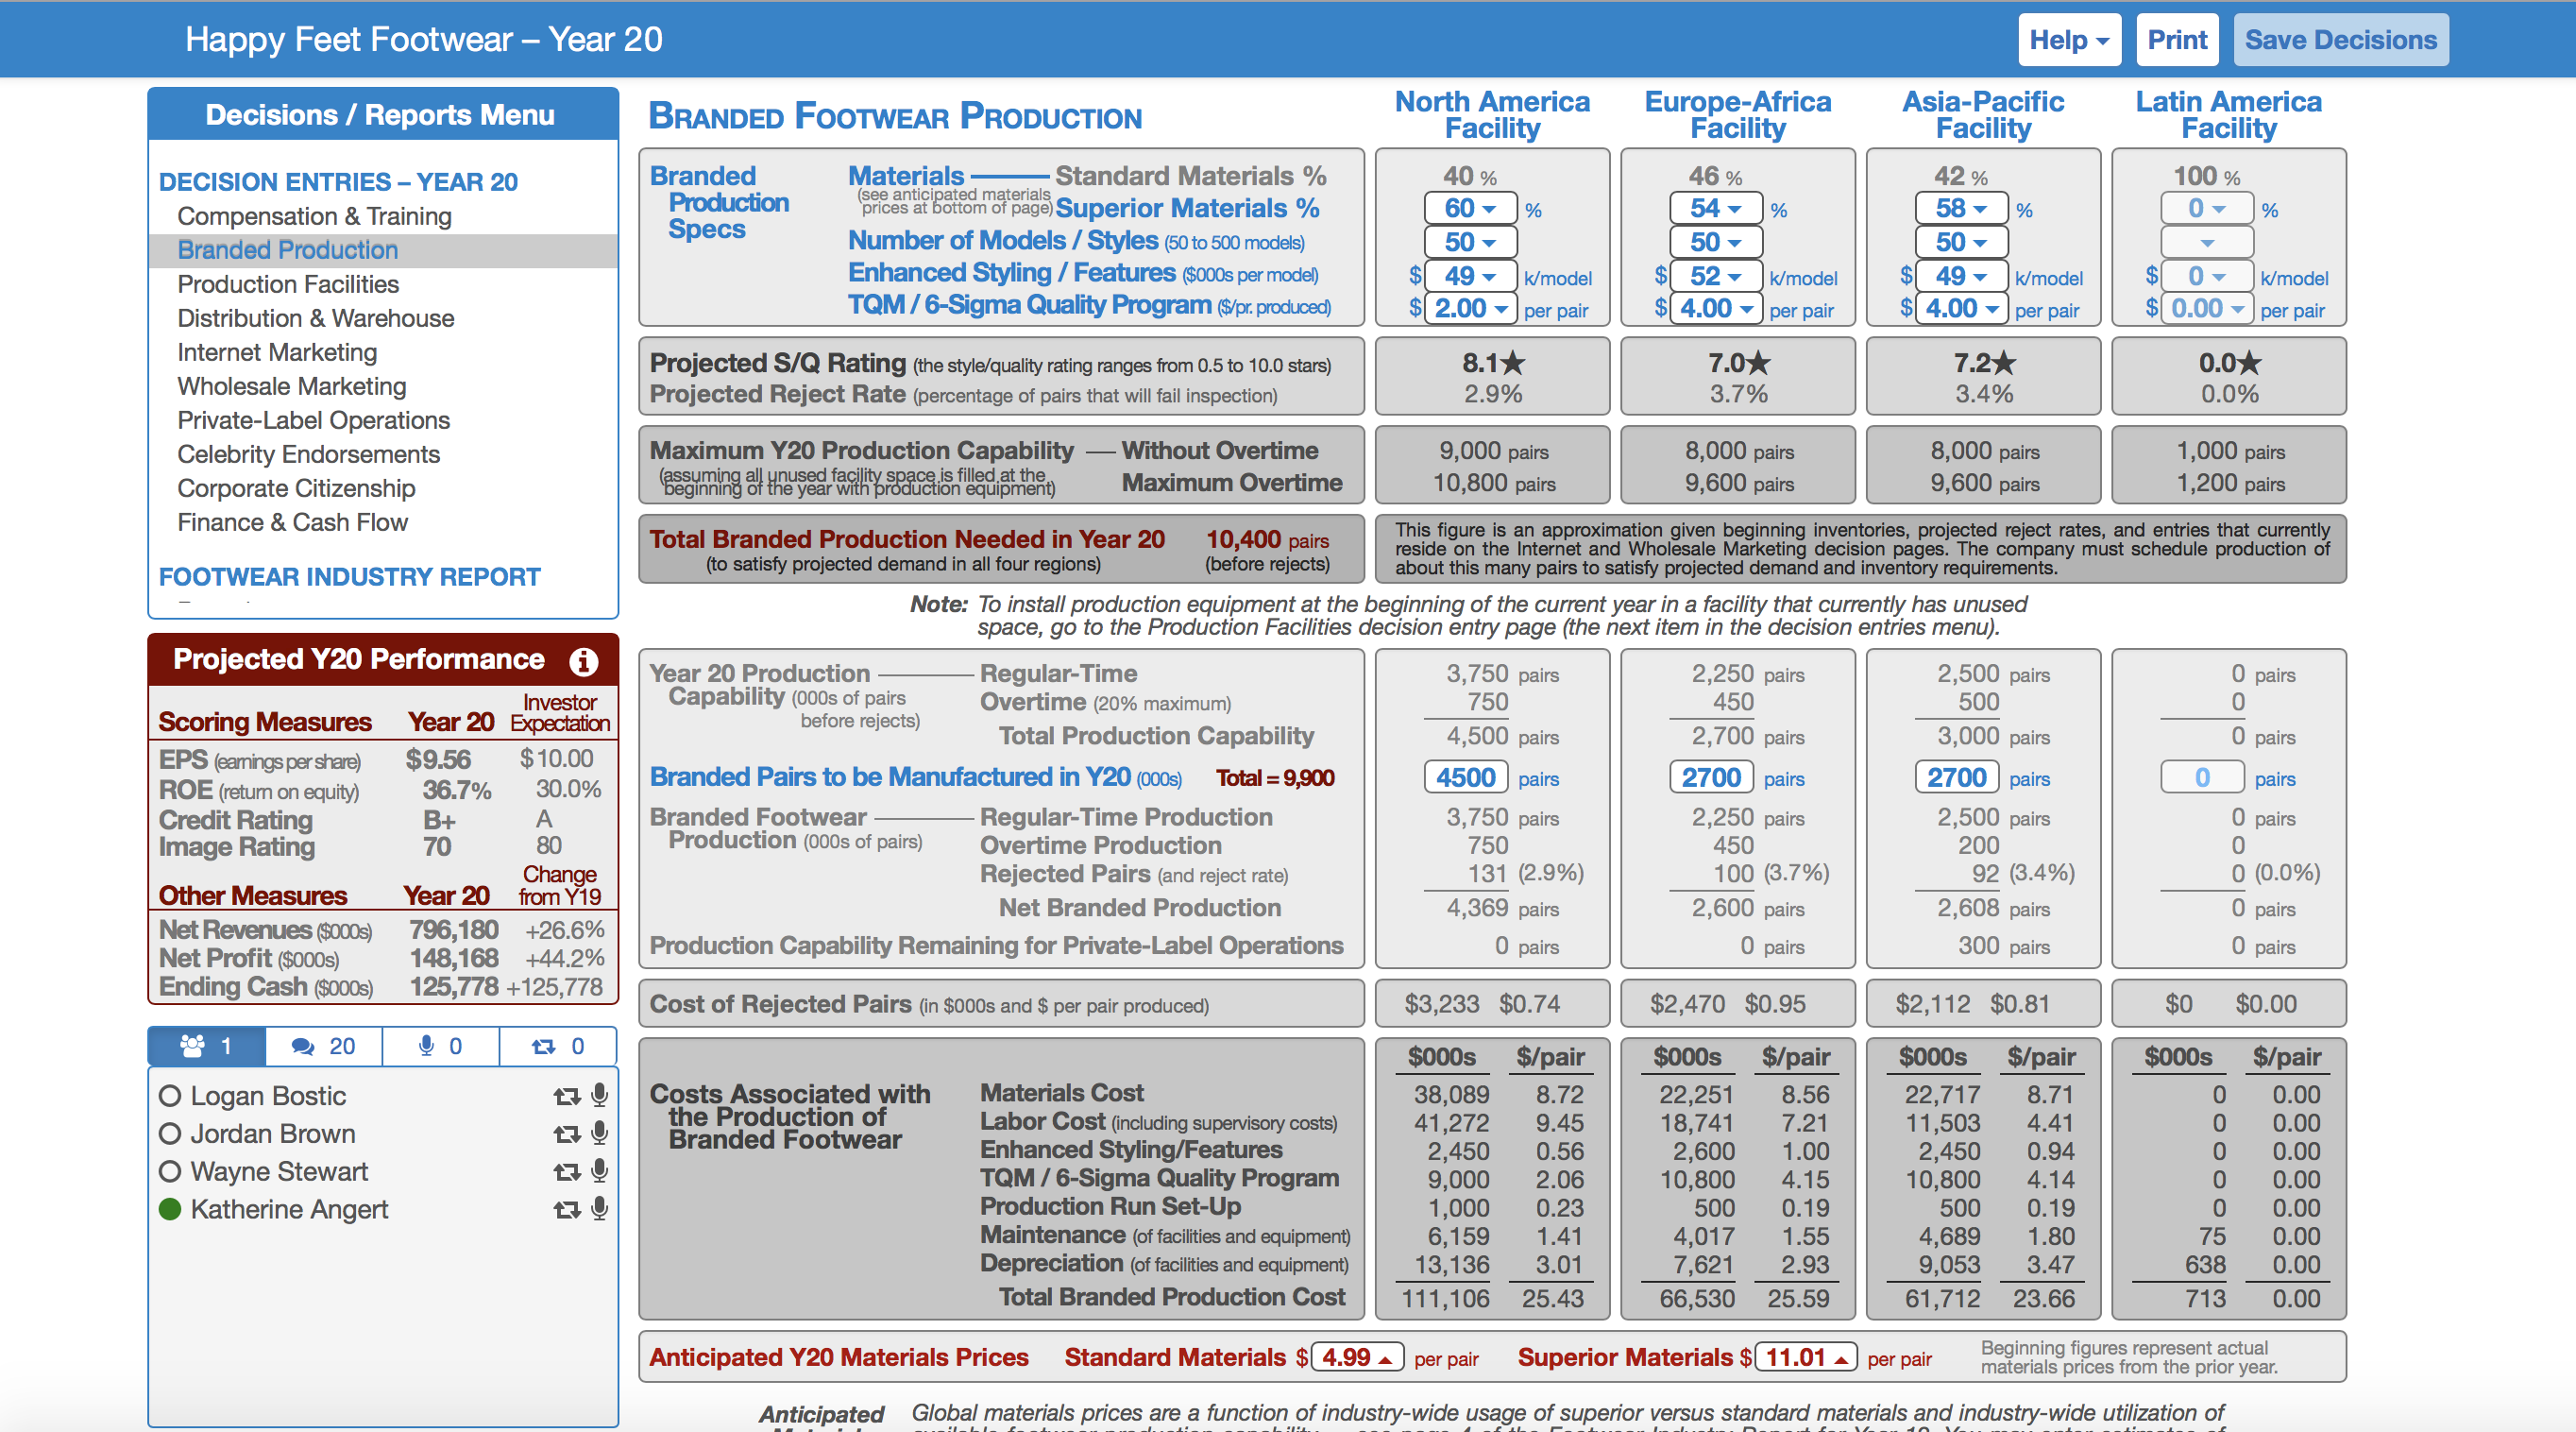
HEgov FEEL Foolwear _ Year 20 Help +\\ Print\\ Save Decisions BRANDED FOOTWEAR PRODUCTION North America Europe - Africa Asia - Pacific Latin America Facility Facility Facility Facility DECISION ENTRIES - YEAR 20 Branded Materials Standard Materials % 40 % 46 % 42 % 100 % Compensation & Training Production 60 - 1 9/0 54 +\\ %) 58 + \\ %) O - Specs prices at bottom of page ) Superior Materials %/ Branded Production Number of Models / Styles ( 50 to 500 models )| 50 - 50 - 50 - Production Facilities* Enhanced Styling / Features ( 5000s per model) $ | 49 -\\K/ model $ 1 52 -\\K/model! $ 1 49 + \\K/mode! \\Or J K/ model Distribution & Warehouse* TQM / 6 - Sigma Quality Program ( $/ pr . produced) $ [ 2. 00 -\\ per pair $ 1 4. 00 -\\per pair $ 1 4. 00 -\\ per pair $ 1 0. 00 - \\ per pair Internet Marketing Projected S /Q Rating ( the style/ quality rating ranges from 0 . 5 to 10. 0 stars) 8 . 1 * 7. 0 * 7.2* 0. 0* Wholesale Marketing Projected Reject Rate ( percentage of pairs that will fail inspection ) 2. 9% 3. 7%% 3. 4%0 0. 0% Private - Label Operations Celebrity Endorsements Maximum Y 20 Production Capability\\ - Without Overtime 3, 000 pairs 3, 000 pairs 3, 000 pairs ,000 pairs Corporate Citizenship assuring all Unused to a facility space is filled . at the Maximum Overtime 10, 800 pairs 9 , 600 pairs 9 , 600 pairs* 1 , 200 pairs Finance & Cash Flow Total Branded Production Needed in Year 20 10, 400 pairs This figure is an approximation given beginning inventories , projected reject rates , and entries that currently reside on the Internet and Wholesale Marketing decision pages . The company must schedule production Of FOOTWEAR INDUSTRY REPORT ( to satisfy projected demand in all four regions )| ( before rejects ) about this many pairs to satisfy projected demand and inventory requirements . Note : To install production equipment at the beginning of the current year in a facility that currently has unused space , go to the Production Facilities decision entry page ( the next item in the decision entries menu ) . Year 20 Production - Regular - Time 3 , 750 pairs* 2 , 250 pairs 2 , 500 pairs O pairs Investor Capability (000s of pairs 750 450 500 O Scoring Measures Year 20 1 Expectation before rejects ) Overtime ( 20% maximum ) 4 , 500 pairs 2, 700 pairs O pairs $9.56 $ 10. 00 Total Production Capability 3, 000 pairs EPS ( earnings per share ) ROE ( return on equity ) 36.7% 30.0% Branded Pairs to be Manufactured in Y 20 ( 000s )\\ Total = 9 , 900 4500\\ pairs 2700\\ pairs 2700] pairs _ O ] pairs Credit Rating B+ Branded Footwear Regular - Time Production 3 , 750 pairs 2 , 250 pairs 2 , 500 pairs O pairs Image Rating 70 80 Production ( 000s of pairs ) Overtime Production* 750 450 200 0 Change Rejected Pairs ( and reject rate ) 131 ( 2.9% ) 100 ( 3. 7% )| 92 ( 3.4% )| 0 1 0 . 0% )| Other Measures Year 20 from Y 19 Net Branded Production 4 , 369 pairs 2 , 600 pairs 2 , 608 pairs O pairs Net Revenues ( 8000s)! 796, 180| + 26.6% O pairs Net Profit ( 5000s ) 148, 168\\ } + 44 . 2% Production Capability Remaining for Private - Label Operations O pairs O pairs 300 pairs Ending Cash ( 5000s ) 125, 778 + 125, 778 Cost of Rejected Pairs ( in SOOOs and $ per pair produced ) $3 , 233 $0. 74 $2 , 470 80. 95 $2 , 172 80. 87 SO $0. 00 2 20 8 0 17 6 0 SOOOS $ /pair SOOOS $ / pair SOOOS $ / pair SOOOS S / pair Logan Bostic Costs Associated with Materials Cost 38, 089 8.72 22, 257 8.56 22, 717 8.7 - O 0 . 00 Jordan Brown the Production of 9. 45 7.21 17 , 503\\ O Branded Footwear Labor Cost ( including supervisory costs) 41 , 272 18, 741 4. 41 0 . 00 Wayne Stewart 17 {| Enhanced Styling / Features 2, 450 0 . 56 2 , 600 1.00 2, 450 0 . 94 O 0. 00 TQM / 6 - Sigma Quality Program 9. 000 2. 06 10, 800 4. 15 10, 800 4 . 14 O 0. 00 Katherine Angert 17 0 Production Run Set- Up 1. 000 0 . 23 500 0 . 19 500 0 . 19 O 0 . 00 Maintenance ( of facilities and equipment ) 6 , 159 1.47 4 , 017 1.55 4, 689 1. 80 75 0 . 00 Depreciation ( of facilities and equipment ) 13 , 136\\ 3. 01 7 , 621 2.93 9, 053 3.47 638 0 . 00 Total Branded Production Cost 171 , 106 25.43 6 6, 530 25.59 61 , 712 23.66 713 0 . 00 Anticipated Y 20 Materials Prices Standard Materials $ ( 4. 99 ~] per pair Superior Materials $ ( 11 . 01 ~\\ per pair Beginning figures represent actual materials prices from the prior year . Anticipated ( Global materials prices are a function of industry - wide usage of superior versus standard materials and industry - wide utilization of