

Question: I need some quick help please!! comprenensive Propiem 2 - St of Casn Flows and Ratios Algo T. Mulholland T. Mulholland Income Statement Comparative Balance
I need some quick help please!!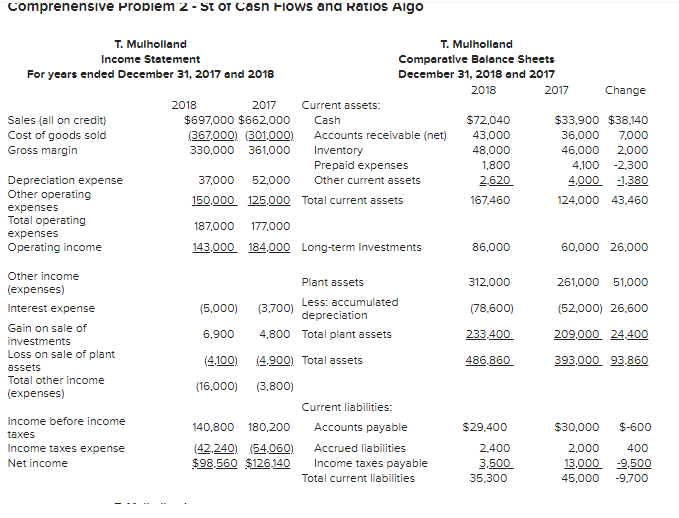
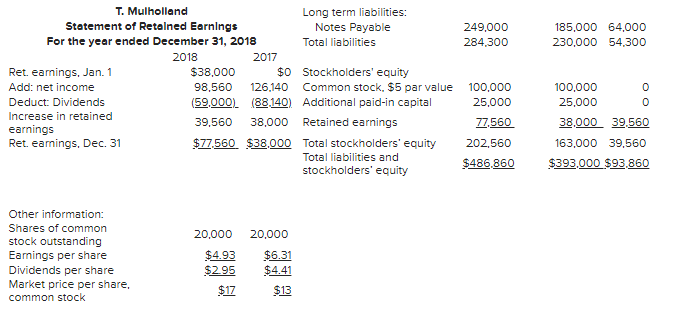
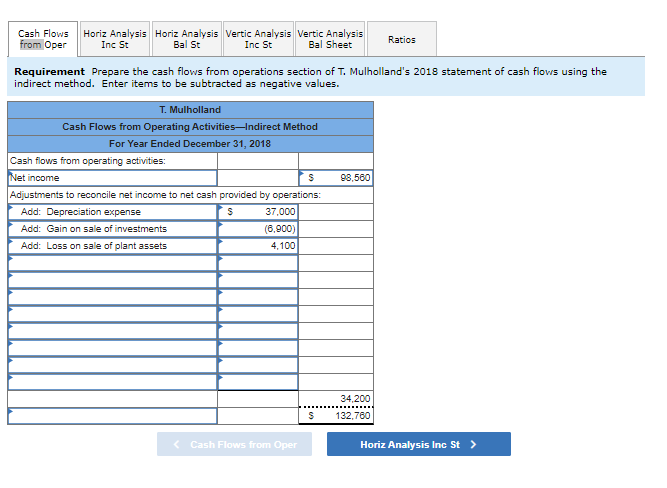
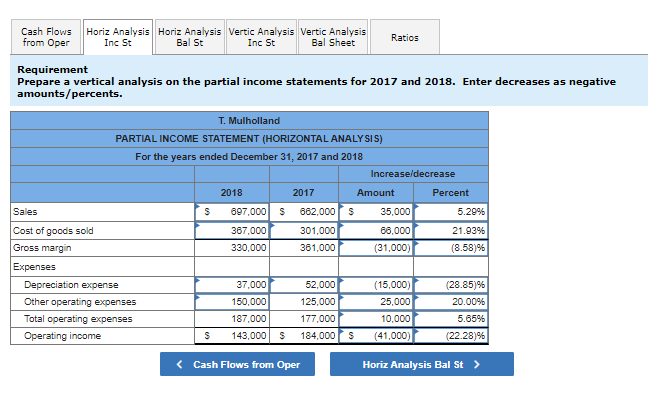
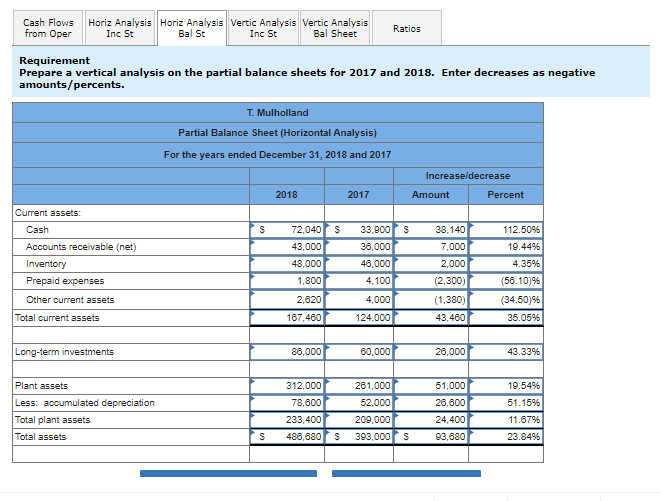
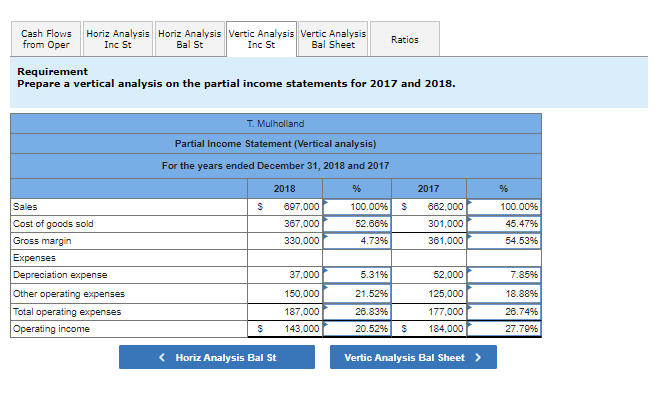
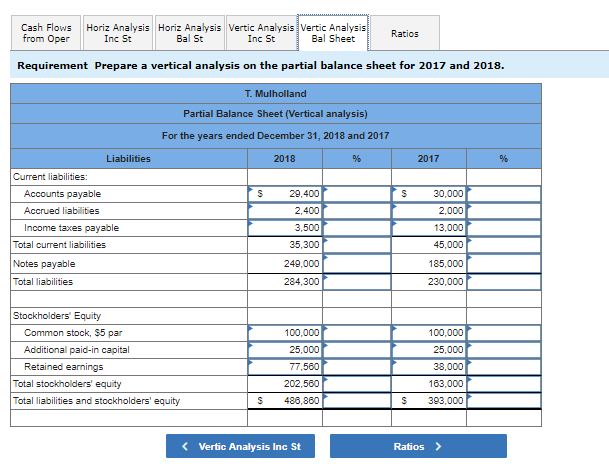
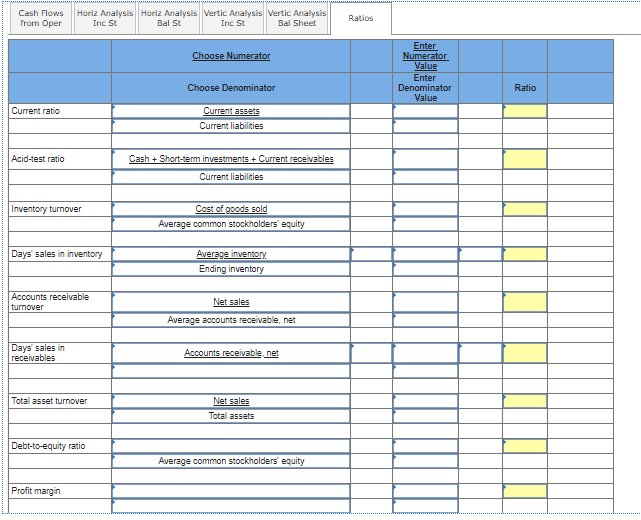
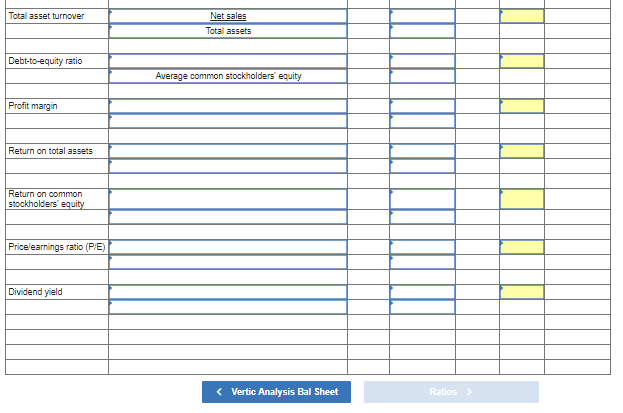
comprenensive Propiem 2 - St of Casn Flows and Ratios Algo T. Mulholland T. Mulholland Income Statement Comparative Balance Sheets For years ended December 31, 2017 and 2018 December 31, 2018 and 2017 2018 2017 Change 2018 2017 Current assets: Sales (all on credit) $697.000 $662,000 Cash $72,040 $33,900 $38.140 Cost of goods sold (367.000) (301.000) Accounts receivable (net) 43,000 36,000 7,000 Gross margin 330,000 361,000 Inventory 48.000 46,000 2,000 Prepaid expenses 1,800 4,100 -2.300 Depreciation expense 37,000 52.000 Other current assets 2.620 4,000 -1,380 Other operating 150.000 125.000 Total current assets 167.460 124,000 43.460 expenses Total operating 187,000 177,000 expenses Operating income 143.000 184,000 Long-term Investments 86,000 60.000 26.000 312.000 261,000 51,000 (78.600) (52,000) 26,600 Other income (expenses) Interest expense Gain on sale of investments Loss on sale of plant assets Total other income (expenses) 233.400 209.000 24.400 486.860 393.000 93.860 Plant assets (5.000) (3.700) Less: accumulated depreciation 6.900 4,800 Total plant assets (4.100) (4.900). Total assets (16,000) (3.800) Current liabilities: 140.800 180,200 Accounts payable (42.240). (54.060) Accrued liabilities $98.560 $126.140 Income taxes payable Total current liabilities $29.400 $30,000 $-600 Income before income taxes Income taxes expense Net income 2.400 3.500 35.300 2.000 400 13.000 -9.500 45,000 -9.700 249,000 284.300 185,000 64.000 230,000 54.300 T. Mulholland Long term liabilities: Statement of Retained Earnings Notes Payable For the year ended December 31, 2018 Total liabilities 2018 2017 Ret. earnings, Jan. 1 $38,000 $0 Stockholders' equity Add: net income 98,560 126.140 Common stock. $5 par value Deduct: Dividends (59.000) (88.140) Additional paid-in capital Increase in retained 39,560 38,000 Retained earnings earnings Ret. eamings, Dec. 31 $77.560 $38,000 Total stockholders' equity Total liabilities and stockholders' equity 100,000 25,000 77.560 202,560 $486.860 100.000 0 25,000 0 38.000 39.560 163,000 39,560 $393.000 $93.860 20.000 Other information: Shares of common stock outstanding Eamings per share Dividends per share Market price per share, common stock $4.93 $2.95 $17 20,000 $6.31 $4.41 $13 Cash Flows from Oper Horiz Analysis Horiz Analysis Vertic Analysis Vertic Analysis Inc St Bal St Inc St Bal Sheet Ratios Requirement Prepare the cash flows from operations section of T. Mulholland's 2018 statement of cash flows using the indirect method. Enter items to be subtracted as negative values. T. Mulholland Cash Flows from Operating ActivitiesIndirect Method For Year Ended December 31, 2018 Cash flows from operating activities: Net income S Adjustments to reconcile net income to net cash provided by operations: Add: Depreciation expense S 37,000 Add: Gain on sale of investments (6,900) Add: Loss on sale of plant assets 4,100 98,560 34,200 132,780 S (Cash Flows from Oper Horiz Analysis Inc St > Cash Flows from Oper Horiz Analysis Horiz Analysis Vertic Analysis Vertic Analysis Inc St Bal St Inc St Bal Sheet Ratios Requirement Prepare a vertical analysis on the partial income statements for 2017 and 2018. Enter decreases as negative amounts/percents. T. Mulholland PARTIAL INCOME STATEMENT (HORIZONTAL ANALYSIS) For the years ended December 31, 2017 and 2018 Increase/decrease 2018 2017 Amount Percent Sales S 697.000 S 662,000 S 35,000 5.29% 367,000 330,000 301.000 361,000 68,000 (31,000) 21.93% (8.58)% Cost of goods sold Gross margin Expenses Depreciation expense Other operating expenses Total operating expenses Operating income 37.000 150.000 187,000 143,000 52.000 125,000 177,000 184,000 (15,000) 25,000 10,000 (41,000) (28.85)96 20.00% 5.65% (22.28)% S S S Cash Flows from Oper Horiz Analysis Horiz Analysis Vertic Analysis Vertic Analysis Inc St Bal St Inc St Bal Sheet Ratios Requirement Prepare a vertical analysis on the partial balance sheets for 2017 and 2018. Enter decreases as negative amounts/percents. T. Mulholland Partial Balance Sheet (Horizontal Analysis) For the years ended December 31, 2018 and 2017 Increase/decrease Amount Percent 2018 2017 s S 33,900 s Current assets: Cash Accounts receivable (net) Inventory Prepaid expenses Other current assets Total current assets 72,040 43,000 48,000 1,800 2,620 167,460 38,000 46,000 4,100 4,000 38,140 7,000 2,000 (2.300) (1.380) 43,480 112.5096 19.449 4.35% (56.10)% (34.50) % 35.05% 124,000 Long-term investments 88,000 60,000 28.000 43.33% 19.54% 51.15% Plant assets Less: accumulated depreciation Total plant assets Total assets 312,000 78,000 233,400 486,680 261,000 52.000 209,000 393,000 51,000 28,600 24,400 93.680 11.67% 23.8496 S S S Cash Flows from Oper Horiz Analysis Horiz Analysis Vertic Analysis Vertic Analysis Inc St Bal St Inc St Bal Sheet Ratios Requirement Prepare a vertical analysis on the partial income statements for 2017 and 2018. T. Mulholland Partial Income Statement (Vertical analysis) For the years ended December 31, 2018 and 2017 2017 662,000 Sales S S 2018 697.000 367,000 330,000 100.00% 52.68% 4.7396 % 100.00% 45.47% 54.5396 301.000 361,000 Cost of goods sold Gross margin Expenses Depreciation expense Other operating expenses Total operating expenses Operating income 37,000 5.3196 52,000 7.85% 150,000 187,000 143,000 21.52% 26.839 20.529 $ 125,000 177,000 184,000 18.88% 26.7496 27.7996 S Cash Flows from Oper Horiz Analysis Horiz Analysis Vertic Analysis Vertic Analysis Inc St Bal St Inc St Bal Sheet Ratios Requirement Prepare a vertical analysis on the partial balance sheet for 2017 and 2018. T. Mulholland Partial Balance Sheet (Vertical analysis) For the years ended December 31, 2018 and 2017 2018 % 2017 % S 30,000 Liabilities Current liabilities: Accounts payable Accrued liabilities Income taxes payable Total current liabilities 29.400 2,400 3,500 35,300 2,000 13.000 45,000 185,000 Notes payable Total liabilities 249,000 284,300 230,000 Stockholders' Equity Common stock, $5 par Additional paid-in capital Retained earnings Total stockholders' equity Total liabilities and stockholders' equity 100,000 25,000 77,500 202.560 486,860 100,000 25,000 38,000 163.000 393,000 S S Cash Flows from Oper Horiz Analysis Horiz Analysis Vertic Analysis Vertic Analysis Inc St Bal St Inc St Bal Sheet Ratios Choose Numerator Enter Numerator Value Enter Denominator Value Choose Denominator Ratio Current ratio Current assets Current liabilities Acid-test ratio Cash + Short-term investments + Current receivables Current liabilities Inventory turnover Cost of goods sold Average common stockholders' equity Days' sales in inventory Average inventory Ending inventory Accounts receivable turnover Net sales Average accounts receivable, net Days' sales in receivables Accounts receivable net Total asset turnover Net sales Total assets Debt-to-equity ratio Average common stockholders' equity Profit margin Total asset turnover Net sales Total assets Debt-to-equity ratio Average common stockholders' equity Profit margin Return on total assets Return on common stockholders' equity Pricelearnings ratio (PE) Dividend yield
Step by Step Solution
There are 3 Steps involved in it

Get step-by-step solutions from verified subject matter experts