

Question: I need someone help me understand and solve this problem. Table A is in photo no. 2 - Choose your parameters from Table A at
I need someone help me understand and solve this problem.
Table A is in photo no. 2
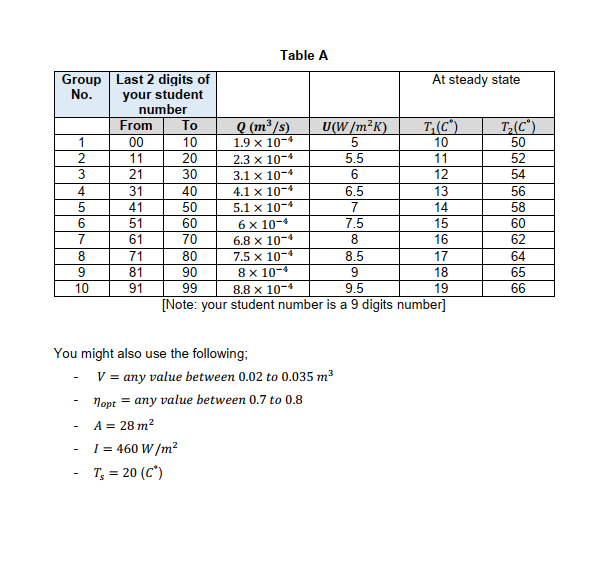
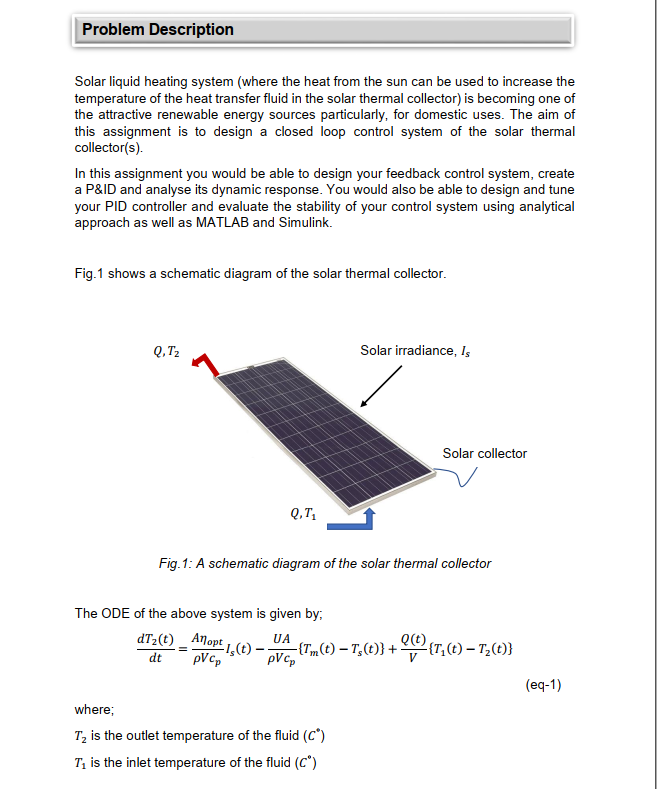
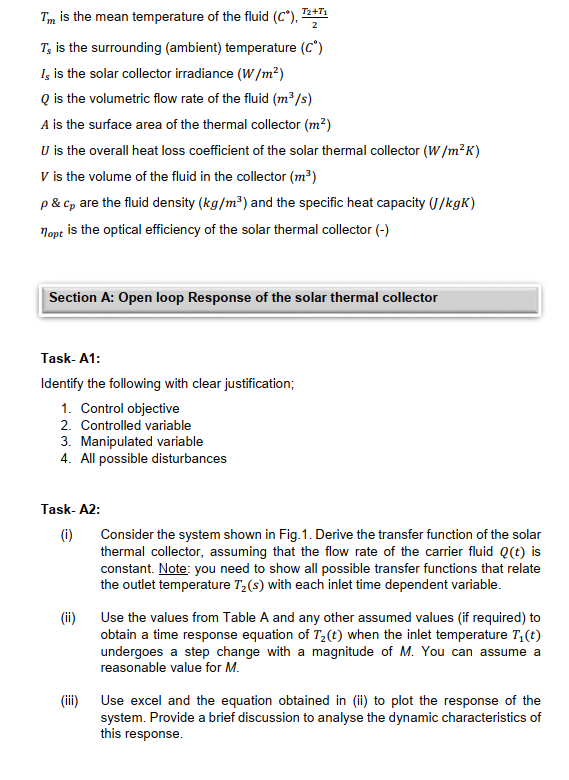
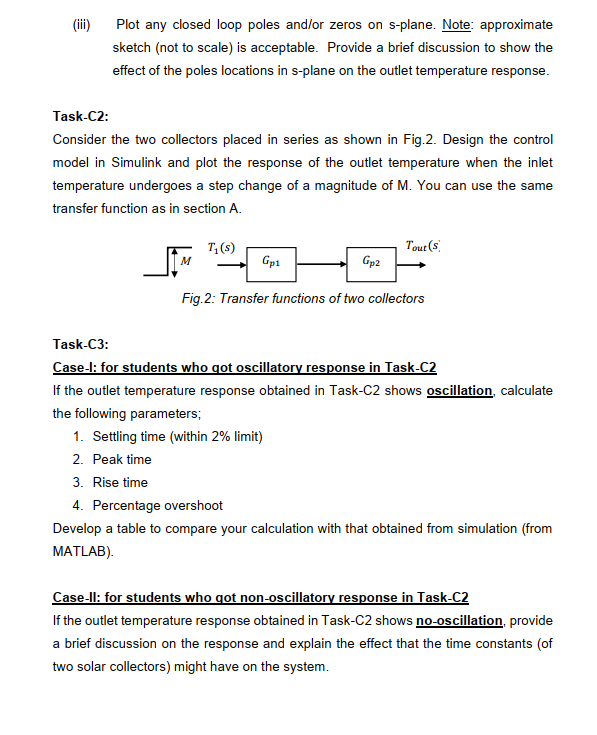
- Choose your parameters from Table A at the end of the assignment. - You should provide valid assumptions for all required parameters you may need, which are not listed in Table A. - Show clearly all your assumptions required to complete the tasks of the assignment and make sure to cite all references. - Use a Harvard referencing system. [Note: your student number is You might also use the following; - V= any value between 0.02 to 0.035m3 - opt= any value between 0.7 to 0.8 - A=28m2 - I=460W/m2 - Ts=20(C) Solar liquid heating system (where the heat from the sun can be used to increase the temperature of the heat transfer fluid in the solar thermal collector) is becoming one of the attractive renewable energy sources particularly, for domestic uses. The aim of this assignment is to design a closed loop control system of the solar thermal collector(s). In this assignment you would be able to design your feedback control system, create a P\&ID and analyse its dynamic response. You would also be able to design and tune your PID controller and evaluate the stability of your control system using analytical approach as well as MATLAB and Simulink. Fig. 1 shows a schematic diagram of the solar thermal collector. Fig.1: A schematic diagram of the solar thermal collector The ODE of the above system is given by; dtdT2(t)=VcpAoptIs(t)VcpUA{Tm(t)Ts(t)}+VQ(t){T1(t)T2(t)} (eq1) where; T2 is the outlet temperature of the fluid (C) T1 is the inlet temperature of the fluid (C) Tm is the mean temperature of the fluid (C),2T2+T1 Ts is the surrounding (ambient) temperature (C) Is is the solar collector irradiance (W/m2) Q is the volumetric flow rate of the fluid (m3/s) A is the surface area of the thermal collector (m2) U is the overall heat loss coefficient of the solar thermal collector (W/m2K) V is the volume of the fluid in the collector (m3) &cp are the fluid density (kg/m3) and the specific heat capacity (J/kgK) opt is the optical efficiency of the solar thermal collector () Section A: Open loop Response of the solar thermal collector Task- A1: Identify the following with clear justification; 1. Control objective 2. Controlled variable 3. Manipulated variable 4. All possible disturbances Task- A2: (i) Consider the system shown in Fig.1. Derive the transfer function of the solar thermal collector, assuming that the flow rate of the carrier fluid Q(t) is constant. Note: you need to show all possible transfer functions that relate the outlet temperature T2(s) with each inlet time dependent variable. (ii) Use the values from Table A and any other assumed values (if required) to obtain a time response equation of T2(t) when the inlet temperature T1(t) undergoes a step change with a magnitude of M. You can assume a reasonable value for M. (iii) Use excel and the equation obtained in (ii) to plot the response of the system. Provide a brief discussion to analyse the dynamic characteristics of this response. (iv) What would be the effect of changing the fluid flow rate on the time constant of the system. Justify your answer. Task- A3: Use MATLAB or Simulink to obtain the responses of the outlet temperature of the solar collector system to step change in each input respectively. Discuss the effect of T1(s),Ts(s) and Is(s) on the outlet temperature. Show all steps and calculations. Task-B1: It is required to control the outlet temperature T2(s) by regulating the heat transer fluid flow rate. Draw a complete Piping \& Instrumentation Diagram (P\&ID) of the closed loop control system for the solar thermal collector. Define all variables and symbols. [It's recommended to use MS Visio. However, you may use any other software, e.g. MS PowerPoint, MS word, etc.] In this section, assume that two identical solar collectors are placed in series where the outlet fluid flow from the first collector enters the second collector. Also, assume that the significant effect on the outlet temperature comes only from the inlet temperature T1(s). Therefore, ignore the effects of other inputs on the system. Task-C1: (i) Develop your closed loop control system using the process transfer function T1(s)T2(s) obtained in section A. You need to assume appropriate transfer functions for the valve and the transmitter in your closed loop control system. Assume that the controller is proportional controller with a gain Kc. (ii) Derive the overall transfer function of the closed loop control system. (iii) Plot any closed loop poles and/or zeros on s-plane. Note: approximate sketch (not to scale) is acceptable. Provide a brief discussion to show the effect of the poles locations in s-plane on the outlet temperature response. Task-C2: Consider the two collectors placed in series as shown in Fig.2. Design the control model in Simulink and plot the response of the outlet temperature when the inlet temperature undergoes a step change of a magnitude of M. You can use the same transfer function as in section A. Task-C3: Case-l: for students who qot oscillatory response in Task-C2 If the outlet temperature response obtained in Task-C2 shows oscillation, calculate the following parameters; 1. Settling time (within 2% limit) 2. Peak time 3. Rise time 4. Percentage overshoot Develop a table to compare your calculation with that obtained from simulation (from MATLAB). Case-Il: for students who qot non-oscillatory response in Task-C2 If the outlet temperature response obtained in Task-C2 shows no-oscillation, provide a brief discussion on the response and explain the effect that the time constants (of two solar collectors) might have on the system. Task- D1: Consider the closed loop control system obtained in Task-C1(i). Analyse the stability of the system by finding the range of Kc that makes the system stable. Task- D2: Design your closed loop control system in Simulink and analyse its stability. You should discuss, at least, the response of the system at three different values of Kc (i.e. one value within the Kc range obtained in Task-D1, one value outside the range and one value at the upper limit of the Kc range). Provide a clear discussion to explain the system response for these three cases. Section E: PID Controller Design Task- E1: The proportional controller in Task-C1 is now replaced by a PID controller. Use a closed loop Z\&N method to tune the PID controller by finding all required controller gains. Task- E2: Use the values of PID controller settings obtained from Ziegler-Nichols (Z\&N) tuning method in Task-E1 and your Simulink model to analyse the response of your control system to a step input using P-only controller, PI and PID respectively. Provide a brief explanation of the advantages of integral and derivative modes in PID controller. [Note: you might need to modify the values obtained from Z&N tuning method to get optimum controller gains that can approximately achieve a quarter decay ratio response]. Justify all your assumptions. - Choose your parameters from Table A at the end of the assignment. - You should provide valid assumptions for all required parameters you may need, which are not listed in Table A. - Show clearly all your assumptions required to complete the tasks of the assignment and make sure to cite all references. - Use a Harvard referencing system. [Note: your student number is You might also use the following; - V= any value between 0.02 to 0.035m3 - opt= any value between 0.7 to 0.8 - A=28m2 - I=460W/m2 - Ts=20(C) Solar liquid heating system (where the heat from the sun can be used to increase the temperature of the heat transfer fluid in the solar thermal collector) is becoming one of the attractive renewable energy sources particularly, for domestic uses. The aim of this assignment is to design a closed loop control system of the solar thermal collector(s). In this assignment you would be able to design your feedback control system, create a P\&ID and analyse its dynamic response. You would also be able to design and tune your PID controller and evaluate the stability of your control system using analytical approach as well as MATLAB and Simulink. Fig. 1 shows a schematic diagram of the solar thermal collector. Fig.1: A schematic diagram of the solar thermal collector The ODE of the above system is given by; dtdT2(t)=VcpAoptIs(t)VcpUA{Tm(t)Ts(t)}+VQ(t){T1(t)T2(t)} (eq1) where; T2 is the outlet temperature of the fluid (C) T1 is the inlet temperature of the fluid (C) Tm is the mean temperature of the fluid (C),2T2+T1 Ts is the surrounding (ambient) temperature (C) Is is the solar collector irradiance (W/m2) Q is the volumetric flow rate of the fluid (m3/s) A is the surface area of the thermal collector (m2) U is the overall heat loss coefficient of the solar thermal collector (W/m2K) V is the volume of the fluid in the collector (m3) &cp are the fluid density (kg/m3) and the specific heat capacity (J/kgK) opt is the optical efficiency of the solar thermal collector () Section A: Open loop Response of the solar thermal collector Task- A1: Identify the following with clear justification; 1. Control objective 2. Controlled variable 3. Manipulated variable 4. All possible disturbances Task- A2: (i) Consider the system shown in Fig.1. Derive the transfer function of the solar thermal collector, assuming that the flow rate of the carrier fluid Q(t) is constant. Note: you need to show all possible transfer functions that relate the outlet temperature T2(s) with each inlet time dependent variable. (ii) Use the values from Table A and any other assumed values (if required) to obtain a time response equation of T2(t) when the inlet temperature T1(t) undergoes a step change with a magnitude of M. You can assume a reasonable value for M. (iii) Use excel and the equation obtained in (ii) to plot the response of the system. Provide a brief discussion to analyse the dynamic characteristics of this response. (iv) What would be the effect of changing the fluid flow rate on the time constant of the system. Justify your answer. Task- A3: Use MATLAB or Simulink to obtain the responses of the outlet temperature of the solar collector system to step change in each input respectively. Discuss the effect of T1(s),Ts(s) and Is(s) on the outlet temperature. Show all steps and calculations. Task-B1: It is required to control the outlet temperature T2(s) by regulating the heat transer fluid flow rate. Draw a complete Piping \& Instrumentation Diagram (P\&ID) of the closed loop control system for the solar thermal collector. Define all variables and symbols. [It's recommended to use MS Visio. However, you may use any other software, e.g. MS PowerPoint, MS word, etc.] In this section, assume that two identical solar collectors are placed in series where the outlet fluid flow from the first collector enters the second collector. Also, assume that the significant effect on the outlet temperature comes only from the inlet temperature T1(s). Therefore, ignore the effects of other inputs on the system. Task-C1: (i) Develop your closed loop control system using the process transfer function T1(s)T2(s) obtained in section A. You need to assume appropriate transfer functions for the valve and the transmitter in your closed loop control system. Assume that the controller is proportional controller with a gain Kc. (ii) Derive the overall transfer function of the closed loop control system. (iii) Plot any closed loop poles and/or zeros on s-plane. Note: approximate sketch (not to scale) is acceptable. Provide a brief discussion to show the effect of the poles locations in s-plane on the outlet temperature response. Task-C2: Consider the two collectors placed in series as shown in Fig.2. Design the control model in Simulink and plot the response of the outlet temperature when the inlet temperature undergoes a step change of a magnitude of M. You can use the same transfer function as in section A. Task-C3: Case-l: for students who qot oscillatory response in Task-C2 If the outlet temperature response obtained in Task-C2 shows oscillation, calculate the following parameters; 1. Settling time (within 2% limit) 2. Peak time 3. Rise time 4. Percentage overshoot Develop a table to compare your calculation with that obtained from simulation (from MATLAB). Case-Il: for students who qot non-oscillatory response in Task-C2 If the outlet temperature response obtained in Task-C2 shows no-oscillation, provide a brief discussion on the response and explain the effect that the time constants (of two solar collectors) might have on the system. Task- D1: Consider the closed loop control system obtained in Task-C1(i). Analyse the stability of the system by finding the range of Kc that makes the system stable. Task- D2: Design your closed loop control system in Simulink and analyse its stability. You should discuss, at least, the response of the system at three different values of Kc (i.e. one value within the Kc range obtained in Task-D1, one value outside the range and one value at the upper limit of the Kc range). Provide a clear discussion to explain the system response for these three cases. Section E: PID Controller Design Task- E1: The proportional controller in Task-C1 is now replaced by a PID controller. Use a closed loop Z\&N method to tune the PID controller by finding all required controller gains. Task- E2: Use the values of PID controller settings obtained from Ziegler-Nichols (Z\&N) tuning method in Task-E1 and your Simulink model to analyse the response of your control system to a step input using P-only controller, PI and PID respectively. Provide a brief explanation of the advantages of integral and derivative modes in PID controller. [Note: you might need to modify the values obtained from Z&N tuning method to get optimum controller gains that can approximately achieve a quarter decay ratio response]. Justify all your assumptions
Step by Step Solution
There are 3 Steps involved in it

Get step-by-step solutions from verified subject matter experts