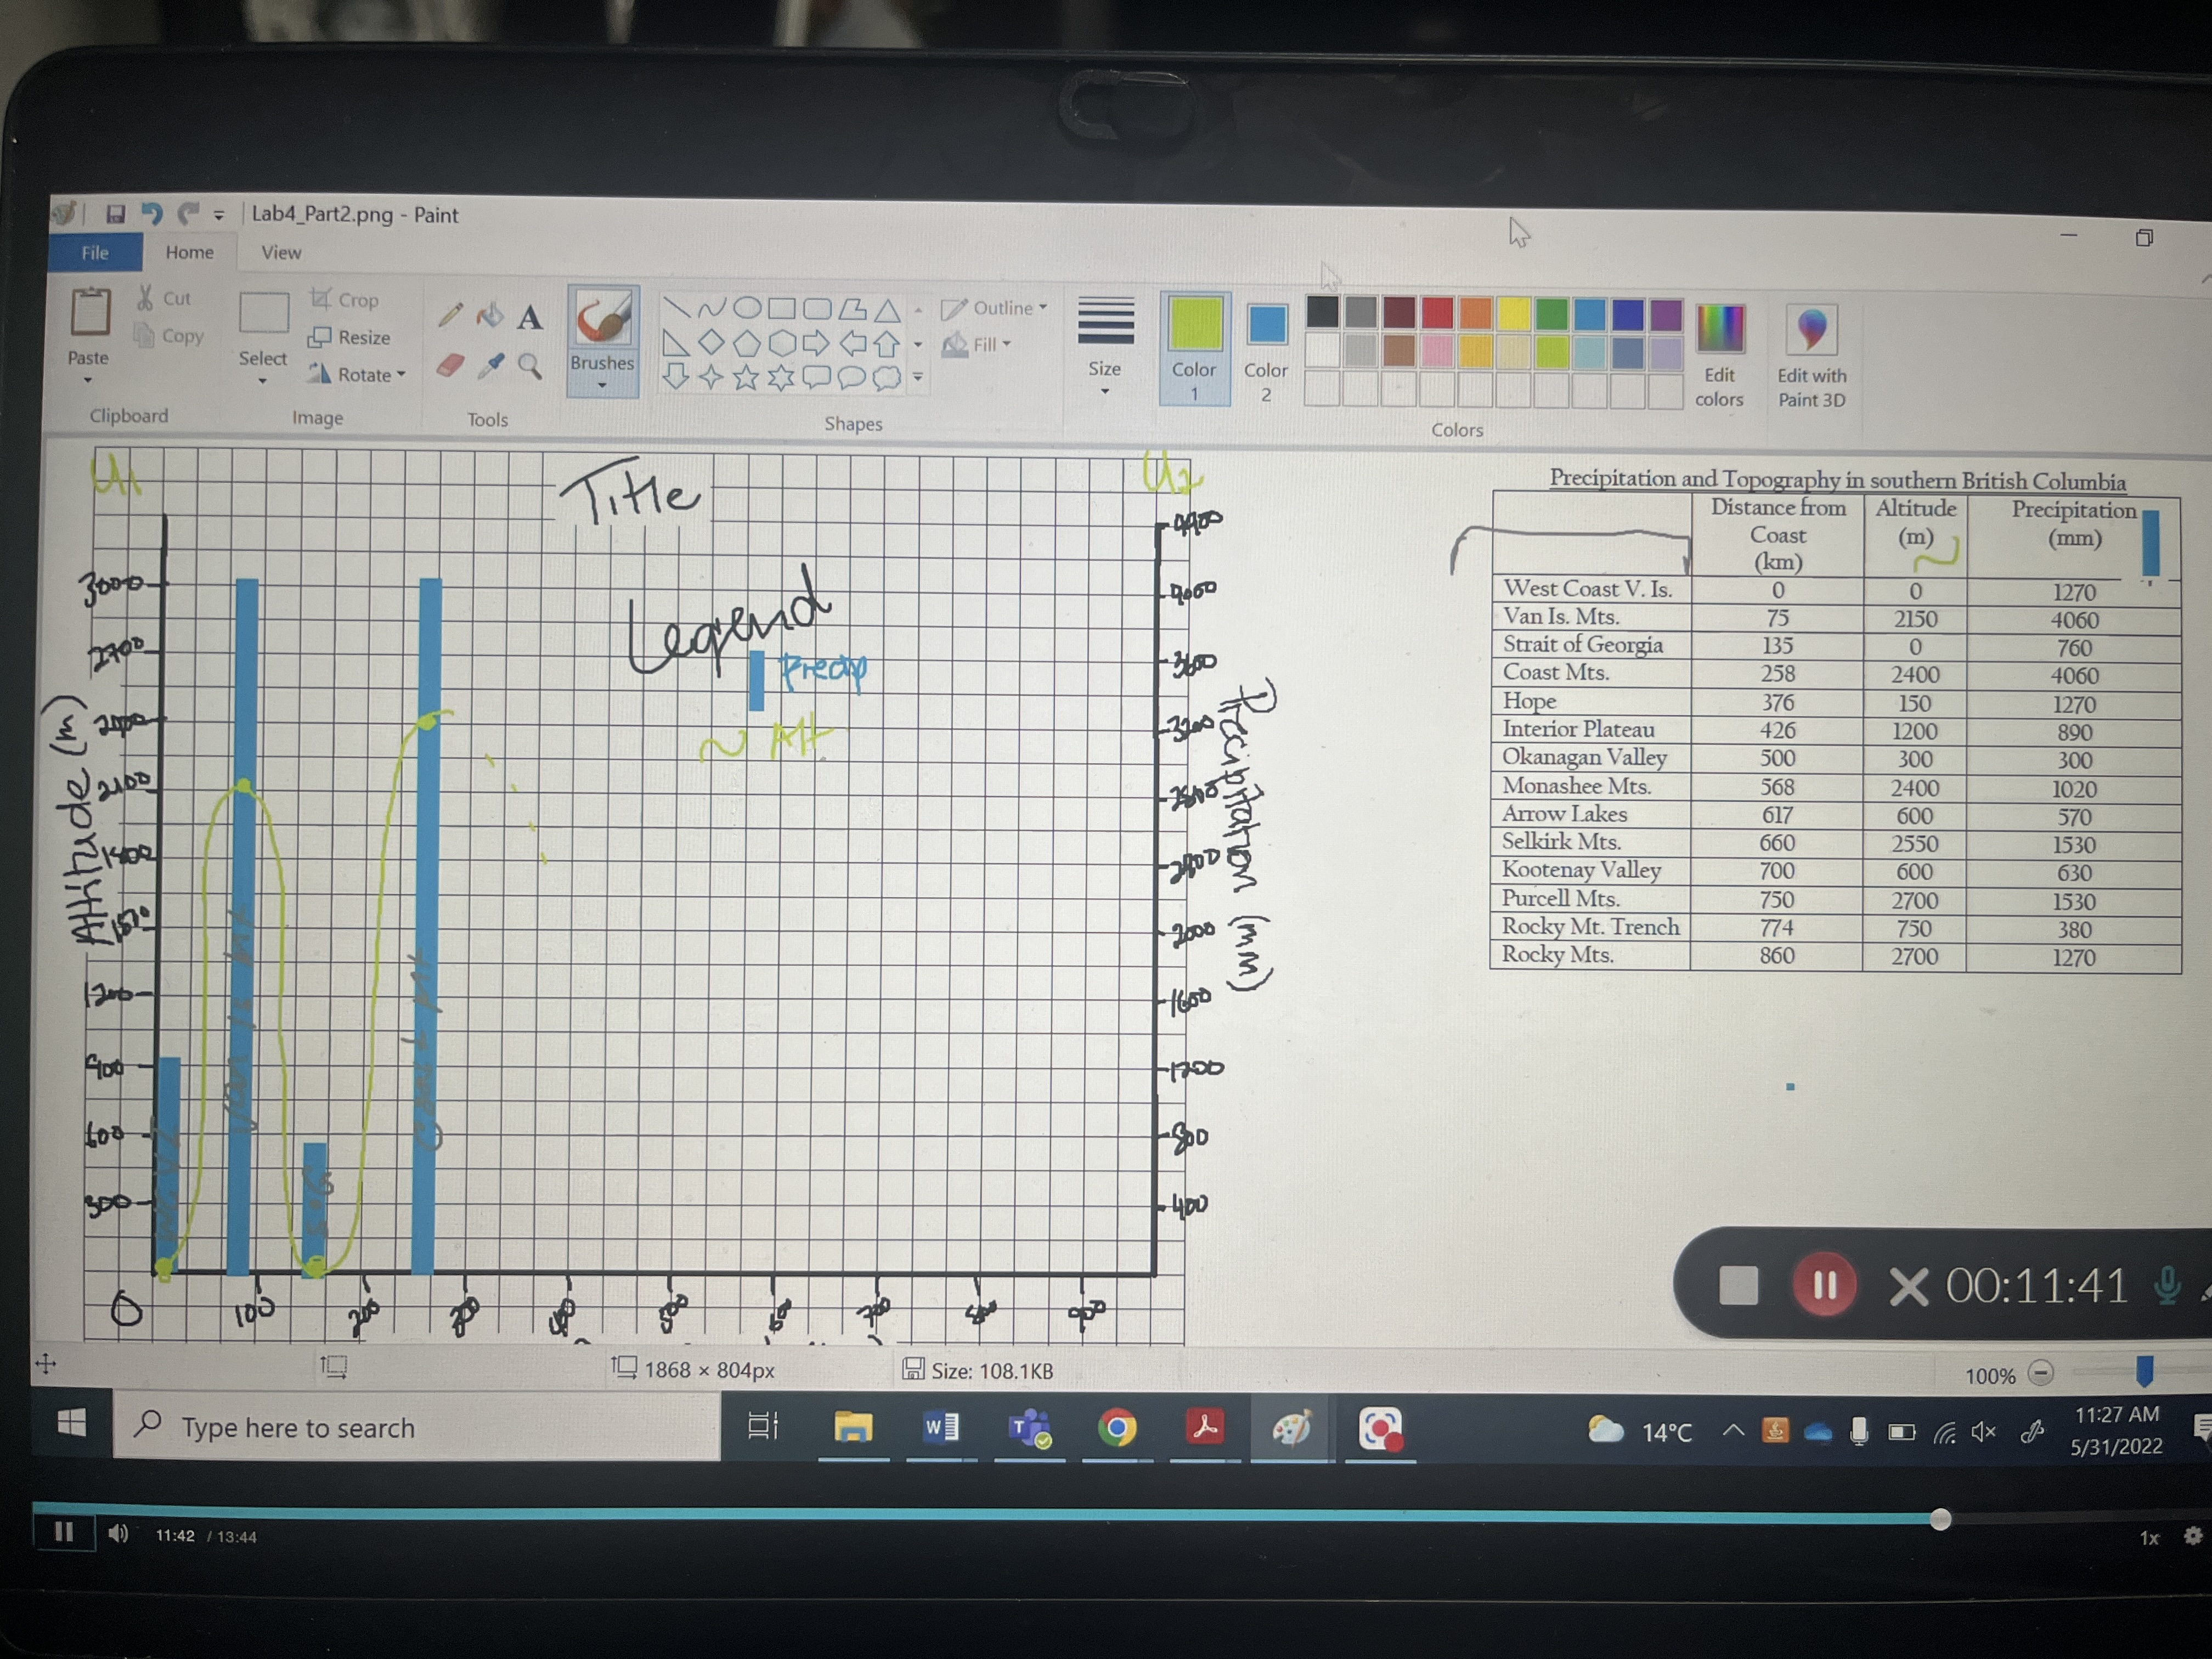
Question: I need someone to fully do the graph - not on excel please... it needs to have curved smooth lines for the line graph, it
I need someone to fully do the graph - not on excel please...
it needs to have curved smooth lines for the line graph, it also needs the bar graph in between it as well... need both done - so fully done :)
it should look like the picture ive attached below ( but i need it fully done) - if you can make the scaling somewhat similar to the picture shown ( but the number off the data in the question 1a ( in the lab ) don't follow the numbers ( the data chart ) in the picture... OnLY use the data chart in the LAB PICTURE WITH THE QUESTION 1A/1B THANKS!!!
Needs a proper legend, - colour coding in the graph should match legend so it makes sense
y1 and y2 axis and x axis.
y1 should be elevation
y2 should be precipitation
x should be distance from coast.
everything should be in neat and tidy.
please be fully specific in 1b- fully explain that - like to a dummy thanks !!!
Need it asap :)
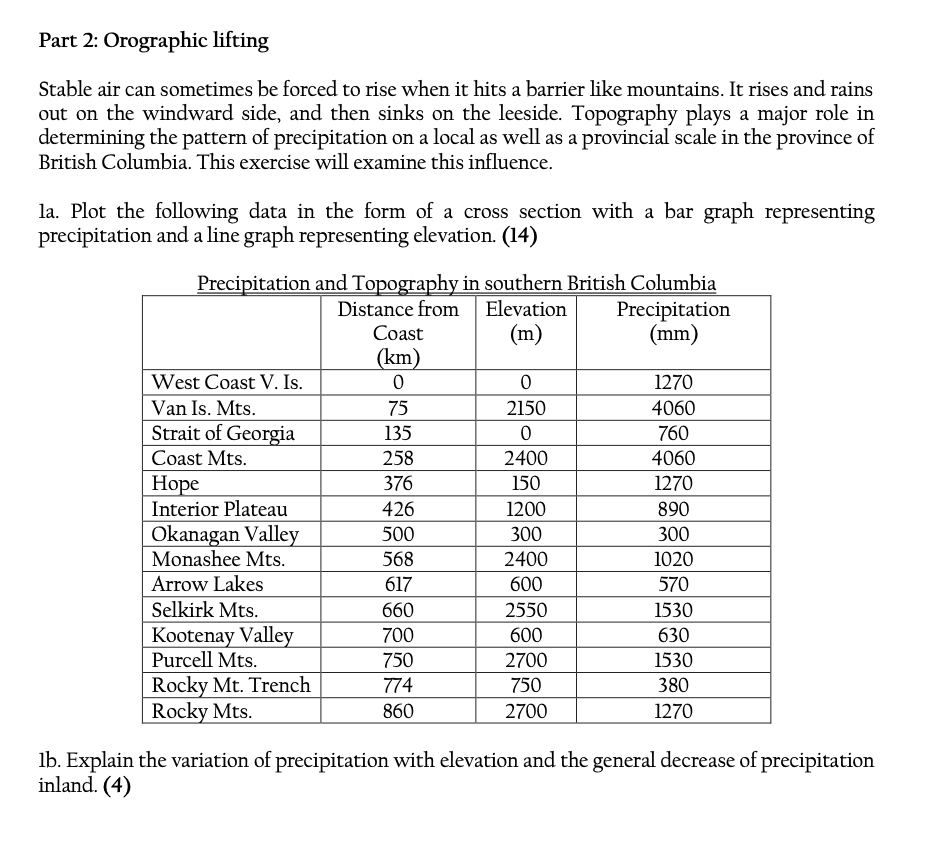
Lab4_Part2.png - Paint File Home View & Cut Crop WODOBA . Outline Copy Resize Paste Select DODODGY . Fill "Rotate Brushes Size Color Color Edit Edit with 1 colors Paint 3D Clipboard Image Tools Shapes Colors Title Precipitation and Topography in southern British Columbia -4900 Distance from Altitude Precipitation Coast (m) (mm) (km West Coast V. Is. 10 1270 2700 Legend Van Is. Mts. 75 2150 4060 Precip Strait of Georgia 135 0 13600 760 Coast Mts. 258 2400 4060 Hope 376 150 1270 Interior Plateau 426 1200 890 Okanagan Valley 500 300 300 2100 Monashee Mrs. 568 2400 1020 Arrow Lakes 617 600 Attitude (m) 570 Precipitation ( mm ) Selkirk Mts. 660 2550 1530 Kootenay Valley 700 600 630 Purcell Mrs. 750 2700 1530 Rocky Mt. Trench 774 750 380 Rocky Mts. 860 2700 1270 400 - 1200 - 80D 300. 400 11 X 00:11:41 0 T 1 1868 x 804px Size: 108.1KB 100% - Type here to search 11:27 AM TO 14 C ~ $ 1064 5/31/2022 11 ) 11:42 / 13:44 1xPart 2: Orographic lifting Stable air can sometimes be forced to rise when it hits a barrier like mountains. It rises and rains out on the windward side, and then sinks on the leeside. Topography plays a major role in determining the pattern of precipitation on a local as well as a provincial scale in the province of British Columbia. This exercise will examine this influence. la. Plot the following data in the form of a cross section with a bar graph representing precipitation and a line graph representing elevation. (14) Precipitation and Topography in southern British Columbia Distance from Elevation Precipitation Coast (m) (mm) (km) West Coast V. Is. 0 0 1270 Van Is. Mts 75 2150 4060 Strait of Georgia 135 0 760 Coast Mts 258 2400 4060 Hope 376 150 1270 Interior Plateau 426 200 390 Okanagan Valley 500 300 300 Monashee Mts. 568 2400 1020 Arrow Lakes 617 600 570 Selkirk Mts. 660 2550 1530 Kootenay Valley 700 600 630 Purcell Mts. 750 2700 1530 Rocky Mt. Trench 774 750 380 Rocky Mts. 860 2700 1270 1b. Explain the variation of precipitation with elevation and the general decrease of precipitation inland. (4)
Step by Step Solution
There are 3 Steps involved in it
1 Expert Approved Answer
Step: 1 Unlock
Question Has Been Solved by an Expert!
Get step-by-step solutions from verified subject matter experts
Step: 2 Unlock
Step: 3 Unlock
Students Have Also Explored These Related Accounting Questions!