Question: I NEED SOMEONE TO FULLY FOLLOW THE LAB - DO EXACTLY AS ASKED IN THE LAB. FOLLOW EVERY AND ALL STEPS THEY ASK FOR EVERY
I NEED SOMEONE TO FULLY FOLLOW THE LAB - DO EXACTLY AS ASKED IN THE LAB. FOLLOW EVERY AND ALL STEPS THEY ASK FOR EVERY QUESTION.
FULLY SHOW WORK PLEASE, SO WHATEVER ANSWER IS FOUND, NEEDS TO HAVE WORK SHOWN.
FOLLOW ANY FORMULAS/EQUATIONS IN THE LAB ( IF ANY - USE THE LAB FORMULAS AND EQUATIONS ETC)
PLEASE HAVE AN EASY TO FOLLOW - STEP BY STEP FOR EVERYTHING.
COLOUR CODE - ANYTHING THAT NEEDS TO BE COLOUR CODED - ANY GRAPH, DRAWING ETC.
QUESTIONS 1A TO 1C NOTE : I NEED HAND WRITTEN WORK FOR THIS QUESTION ( YOU DON'T NEED TO HAND WRITE IT, BUT THERE NEEDS TO BE WORK SHOWN SO it CAN be HANDWRITE IT - USE DIFFERENT COLOURED INK FOR EACH PART OF THE QUESTIONS ANd INCLUDE A LEGEND.. PROPER LEGEND ( SO MAYBE HANDWRITING IT MIGHT BE EASIER)
PART 2 - QUESTION ONE - NEEDS WORK TO BE SHOWN AS WELL - HAVE TO UPLOAD SOMETHING FOR IT - SO MAKE IT EASY TO FOLLOW PLEASE.
QUESTION 1B - HAVE THIS LIKE. A CHART ISH
CLOUDS: ( ANSWER)
PRECIPITATION: (ANSWER)
TEMPERATURE: (ANSWER)
PRESSURE: (ANSWER)
WINDS: (ANSWER.
( EACH EACH PART OF THE QUESTION)
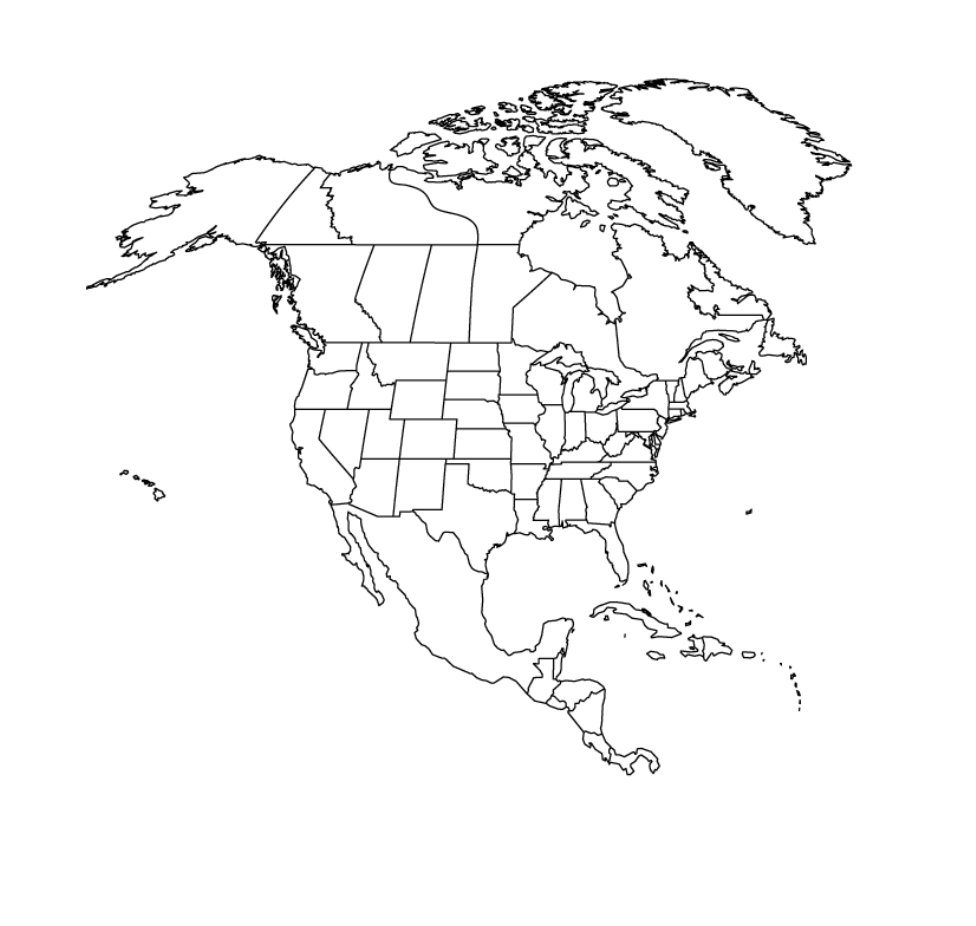
QUESTION 1C - NEED TO SHOW WORK FOR THIS - USE THE MAP GIVEN FOR IT PLEASE!!!!
If. Finally, compare how you did to the actual weather for today. Navigate to https://www.wpc.ncep.noaa.gov/html/sfc2.shtml and look at the latest surface analysis maps from NOAA (the National Oceans and Atmospheric Administration - a US Government service).
Below, discuss your success at predicting the surface front distribution. How well did you do at identifying the fronts? What were the major errors you made? Note that NOAA provides a much more detailed surface analysis than windy.com does, and so NOAA may have more low pressure centres identified than you did. (3) ( THIS IS THE FULLY QUESTION FOR 1F. )
WHEN YOU DO THE LAST PART ( "FINALLY, COMPARE HOW YOU DID TO THE ACTUAL WEATHER TODAY, LET SURE YOU, SAY WHAT DATE YOU DID IT ON) LIKE IF ITS ANSWERED TODAY, JUNE 12TH THEN THE ANSWER IS ONLY FOR TODAY, JUNE (whatever day it is done on)
THANK YOU!
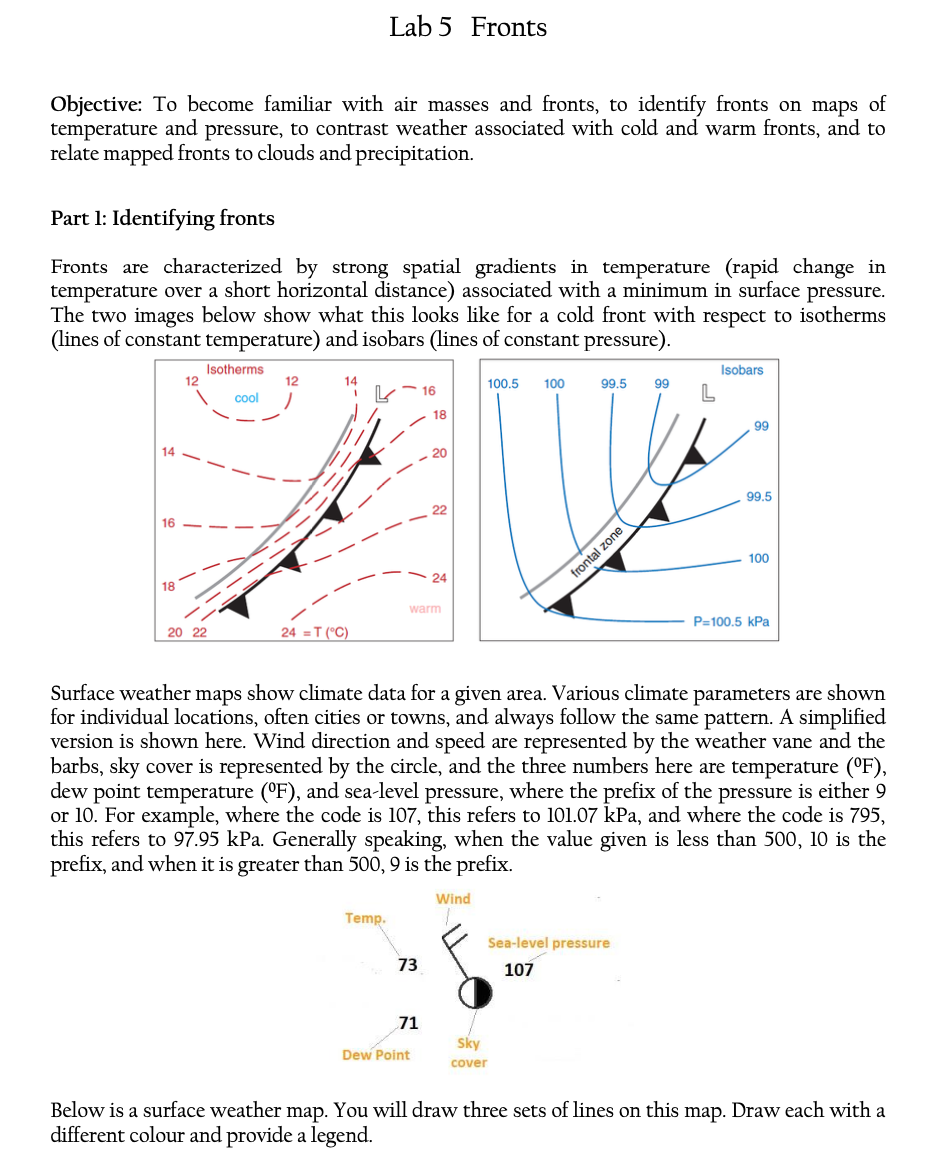
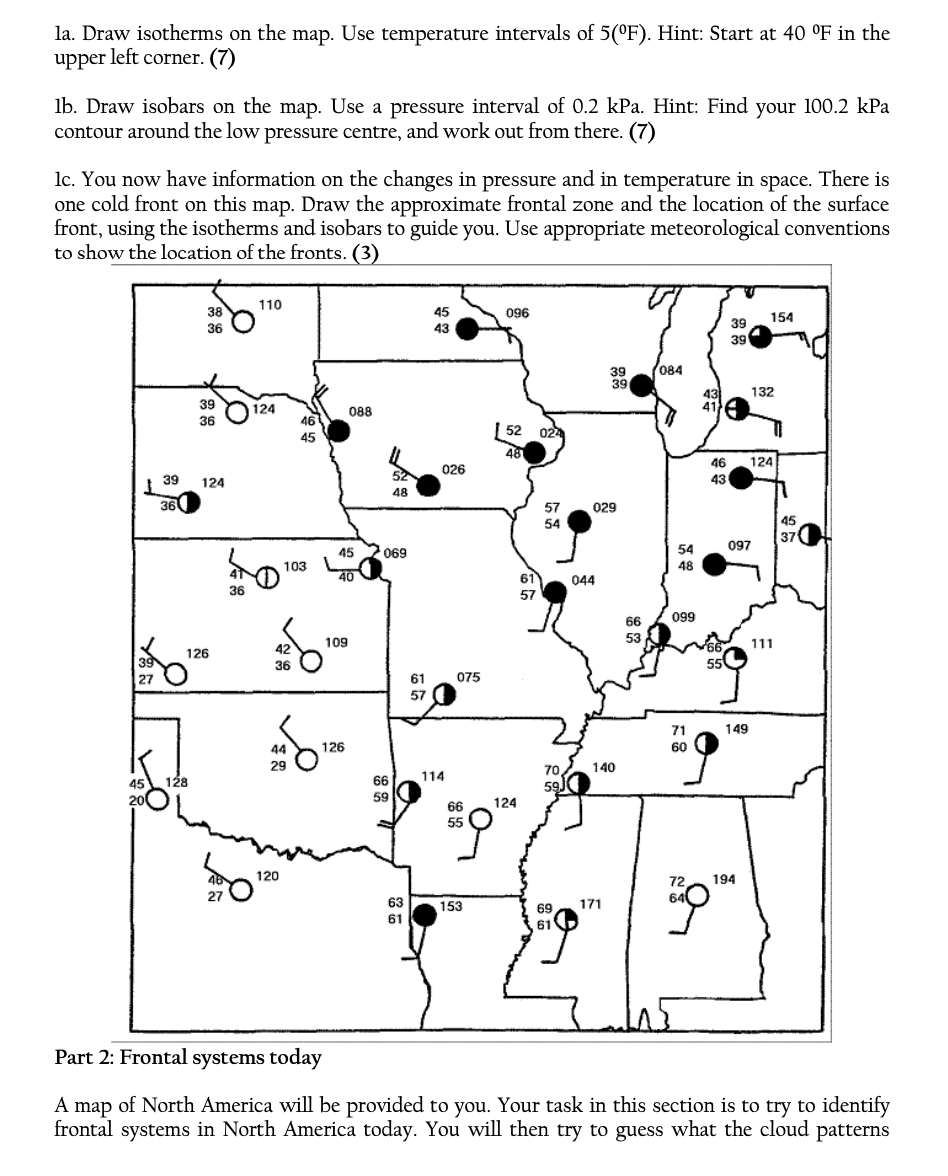
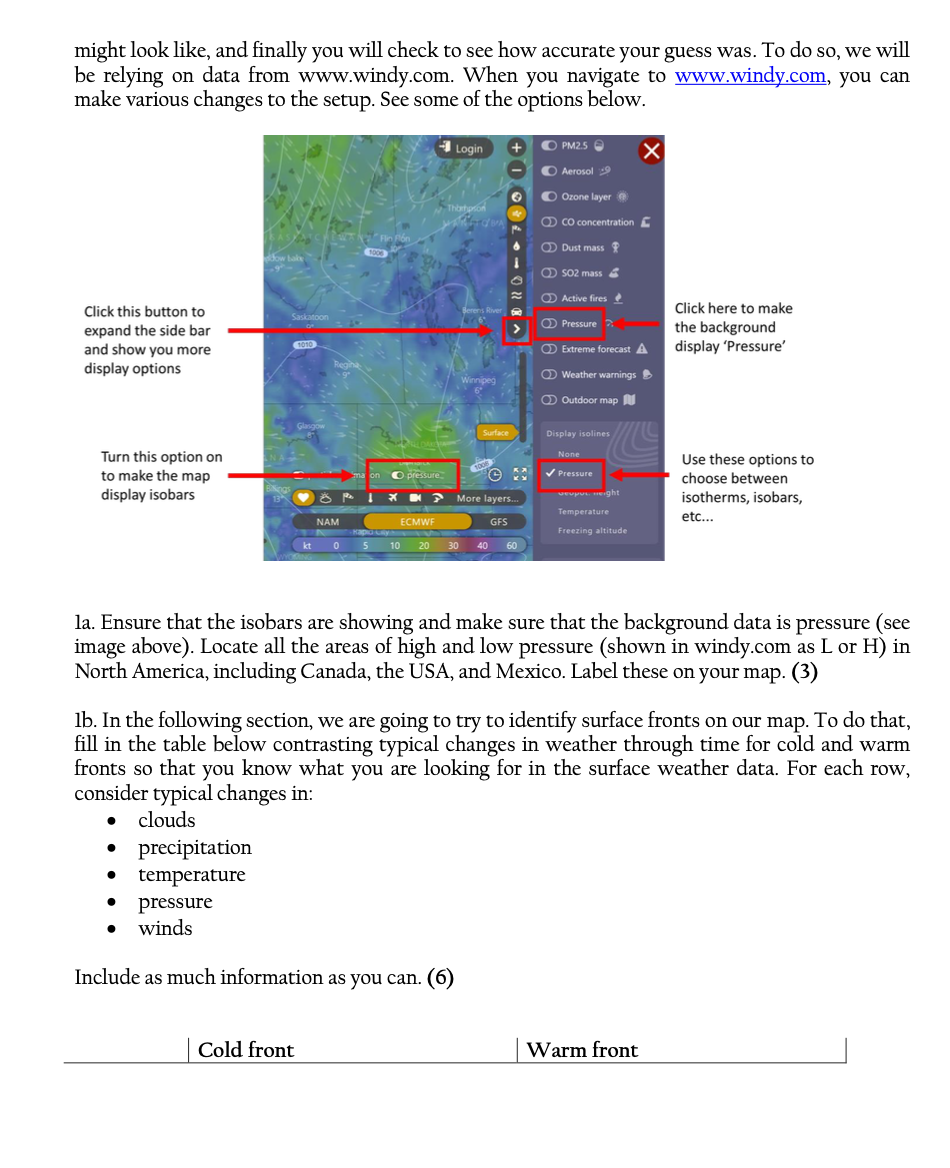
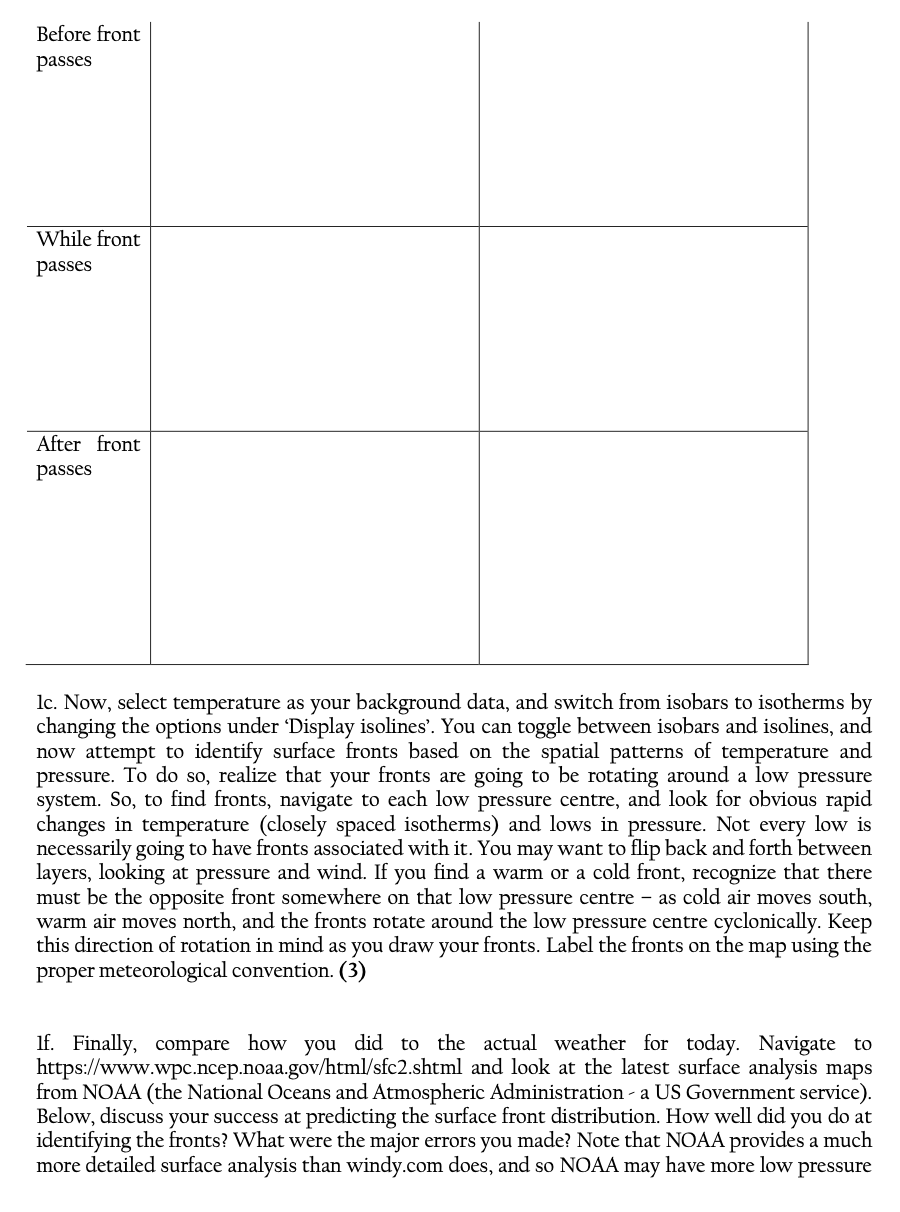
Lab5 Fronts Objective: To become familiar with air masses and fronts, to identify fronts on maps of temperature and pressure, to contrast weather associated with cold and warm fronts, and to relate mapped fronts to clouds and precipitation. Part 1: Identifying fronts Fronts are characterized by strong spatial gradients in temperature (rapid change in temperature over a short horizontal distance) associated with a minimum in surface pressure. The two images below show what this looks like for a cold front with respect to isotherms (lines of constant temperature) and isobars (lines of constant pressure). ,, lsotherms ; Isobars 2 14 100.5 100 99.5 99 99 100 P=100.5 kPa Surface weather maps show climate data for a given area. Various climate parameters are shown for individual locations, often cities or towns, and always follow the same pattern. A simplified version is shown here. Wind direction and speed are represented by the weather vane and the barbs, sky cover is represented by the circle, and the three numbers here are temperature (F), dew point temperature (F), and sea-level pressure, where the prefix of the pressure is either 9 or 10. For example, where the code is 107, this refers to 101.07 kPa, and where the code is 795, this refers to 97.95 kPa. Generally speaking, when the value given is less than 500, 10 is the prefix, and when it is greater than 500, 9 is the prefix. 71 Below is a surface weather map. You will draw three sets of lines on this map. Draw each with a different colour and provide a legend. la. Draw isotherms on the map. Use temperature intervals of 5(F). Hint: Start at 40 F in the upper left corner. (7) lb. Draw isobars on the map. Use a pressure interval of 0.2 kPa. Hint: Find your 100.2 kPa contour around the low pressure centre, and work out from there. (7) lc. You now have information on the changes in pressure and in temperature in space. There is one cold front on this map. Draw the approximate frontal zone and the location of the surface front, using the isotherms and isobars to guide you. Use appropriate meteorological conventions to show the location of the fronts. (3) Part 2: Frontal systems today A map of North America will be provided to you. Your task in this section is to try to identify frontal systems in North America today. You will then try to guess what the cloud patterns might look like, and finally you will check to see how accurate your guess was. To do so, we will be relying on data from www.windy.com. When you navigate to www-.windy.com, you can make various changes to the setup. See some of the options below. Click here to make the background display 'Pressure' Click this button to expand the side bar and show you more display options Turn this option on to make the map display isobars Use these options to choose between isotherms, isobars, etc... la. Ensure that the isobars are showing and make sure that the background data is pressure (see image above). Locate all the areas of high and low pressure (shown in windy.com as L or H) in North America, including Canada, the USA, and Mexico. Label these on your map. (3) lb. In the following section, we are going to try to identify surface fronts on our map. To do that, fill in the table below contrasting typical changes in weather through time for cold and warm fronts so that you know what you are looking for in the surface weather data. For each row, consider typical changes in: clouds precipitation temperature pressure winds Include as much information as you can. (6) Cold front Warm front | Before front Passes While front passes After front passes lc. Now, select temperature as your background data, and switch from isobars to isotherms by changing the options under 'Display isolines'. You can toggle between isobars and isolines, and now attempt to identify surface fronts based on the spatial patterns of temperature and pressure. To do so, realize that your fronts are going to be rotating around a low pressure system. So, to find fronts, navigate to each low pressure centre, and look for obvious rapid changes in temperature (closely spaced isotherms) and lows in pressure. Not every low is necessarily going to have fronts associated with it. You may want to flip back and forth between layers, looking at pressure and wind. If you find a warm or a cold front, recognize that there must be the opposite front somewhere on that low pressure centre as cold air moves south, warm air moves north, and the fronts rotate around the low pressure centre cyclonically. Keep this direction of rotation in mind as you draw your fronts. Label the fronts on the map using the proper meteorological convention. (3) lf. Finally, compare how you did to the actual weather for today. Navigate to https://www.wpc.ncep.noaa.gov/html/sfc2.shtml and look at the latest surface analysis maps from NOAA (the National Oceans and Atmospheric Administration - a US Government service). Below, discuss your success at predicting the surface front distribution. How well did you do at identifying the fronts? What were the major errors you made? Note that NOAA provides a much more detailed surface analysis than windy.com does, and so NOAA may have more low pressure \f
Step by Step Solution
There are 3 Steps involved in it
1 Expert Approved Answer
Step: 1 Unlock
Question Has Been Solved by an Expert!
Get step-by-step solutions from verified subject matter experts
Step: 2 Unlock
Step: 3 Unlock
Students Have Also Explored These Related Accounting Questions!