

Question: I need step by step of calculation and excel step by step, or the sreenshoot how to do it on excel, please. Simple response. #1.
I need step by step of calculation and excel step by step, or the sreenshoot how to do it on excel, please. Simple response.
#1. Researchers compared subjects' anxiety (0-100 scale; lower scores = less anxiety) between 30 students receiving a drug and 30 students receiving a placebo. A t-test resulted in p = .032. The mean for the drug group was 34.56, while the mean for the placebo group was 47.21. The population standard deviation was 7.52. Determine: 1) whether the difference between the two groups is statistically significant; 2) whether the effect size is small, medium, or large (include your calculations).
#2. If a distribution has a mean of 100 and a standard deviation of 15, what value would be +2 standard deviations from the mean? Include your calculations.
#3. (6 points) If a distribution has a mean of 50 and a standard deviation of 25, how many standard deviations is 0 from the mean? Include your calculations.
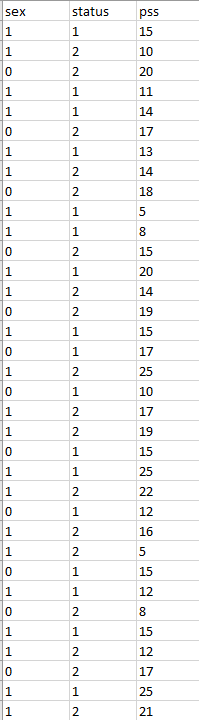
#4. (9 points) Use the dataset HW_Dataset3. Find and report a 95% confidence interval (CI) for the variable PSS. Include your calculations.
\f
Step by Step Solution
There are 3 Steps involved in it

Get step-by-step solutions from verified subject matter experts