

Question: I need the answer as a MATLAB code and please include detailed explanation. Part A: In this part a numerical analysis tool (Scilab/MATLAB/Octave) will be
I need the answer as a MATLAB code and please include detailed explanation.
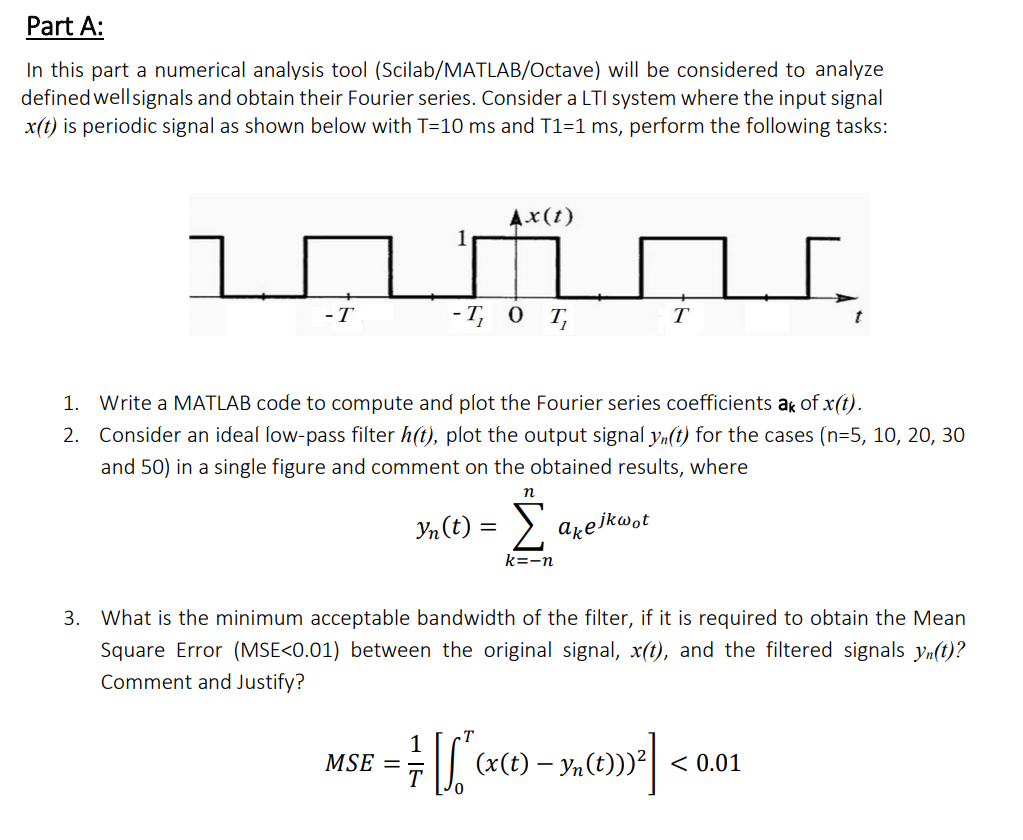
Part A: In this part a numerical analysis tool (Scilab/MATLAB/Octave) will be considered to analyze defined well signals and obtain their Fourier series. Consider a LTI system where the input signal x(t) is periodic signal as shown below with T=10 ms and T1=1 ms, perform the following tasks: AX(t) 1 1 i. -T -TOT 1. Write a MATLAB code to compute and plot the Fourier series coefficients ak of x(t). 2. Consider an ideal low-pass filter h(t), plot the output signal yn(t) for the cases (n=5, 10, 20, 30 and 50) in a single figure and comment on the obtained results, where n Yn(t) = akejkwot k=en 3. What is the minimum acceptable bandwidth of the filter, if it is required to obtain the Mean Square Error (MSE}
Step by Step Solution
There are 3 Steps involved in it

Get step-by-step solutions from verified subject matter experts