

Question: Construct the total rainfall hyetograph (intensity versus time) for the 20-minute storm event using the temporal distribution given in Table 2. The rainfall recorded
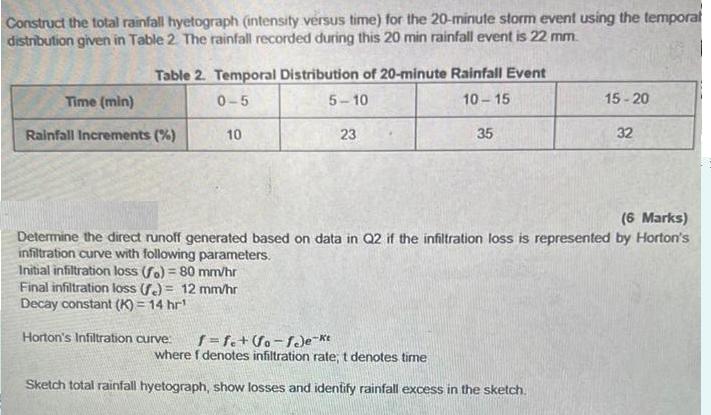
Construct the total rainfall hyetograph (intensity versus time) for the 20-minute storm event using the temporal distribution given in Table 2. The rainfall recorded during this 20 min rainfall event is 22 mm. Table 2. Temporal Distribution of 20-minute Rainfall Event 0-5 5-10 10-15 Time (min) Rainfall Increments (%) 10 Initial infiltration loss (fo) = 80 mm/hr Final infiltration loss (fe) = 12 mm/hr Decay constant (K) = 14 hr 23 Horton's Infiltration curve f=fe+(fo-fje-kt 35 (6 Marks) Determine the direct runoff generated based on data in Q2 if the infiltration loss is represented by Horton's infiltration curve with following parameters. 15-20 where f denotes infiltration rate, t denotes time Sketch total rainfall hyetograph, show losses and identify rainfall excess in the sketch. 32
Step by Step Solution
3.46 Rating (156 Votes )
There are 3 Steps involved in it
f o 0 Fourier series t a anlus ancos nwot ... View full answer

Get step-by-step solutions from verified subject matter experts