Question: I need the answer as soon as possible Draw the graph and the schematic of the rectangles with all the network calculations for the project

I need the answer as soon as possible I need the answer as soon as possible Draw the

Draw the graph and the schematic of the rectangles with all the network calculations for the project whose details are shown in the table below, then answer the questions below Activity Dependency Resource 4 A B D Time (week) a m b 2 4 6 3 6 9 1 2 3 2 2 8 2 4 6 1 3 5 2 2 8 1 2 3 E F G A A, B, C A, B, C E, F 1 2 3 Find critical events Find the value of the variance for the critical path in the project Find the value of the standard deviation for the critical path in the project Find the probability of completing the project in a time less than or equal to the critical path time plus one week Find the probability of completing the project in a time greater than the critical path time plus one week Find the closest value to the pessimistic time to complete the project What is the time to complete the completion of the project that achieves a probability of 90%

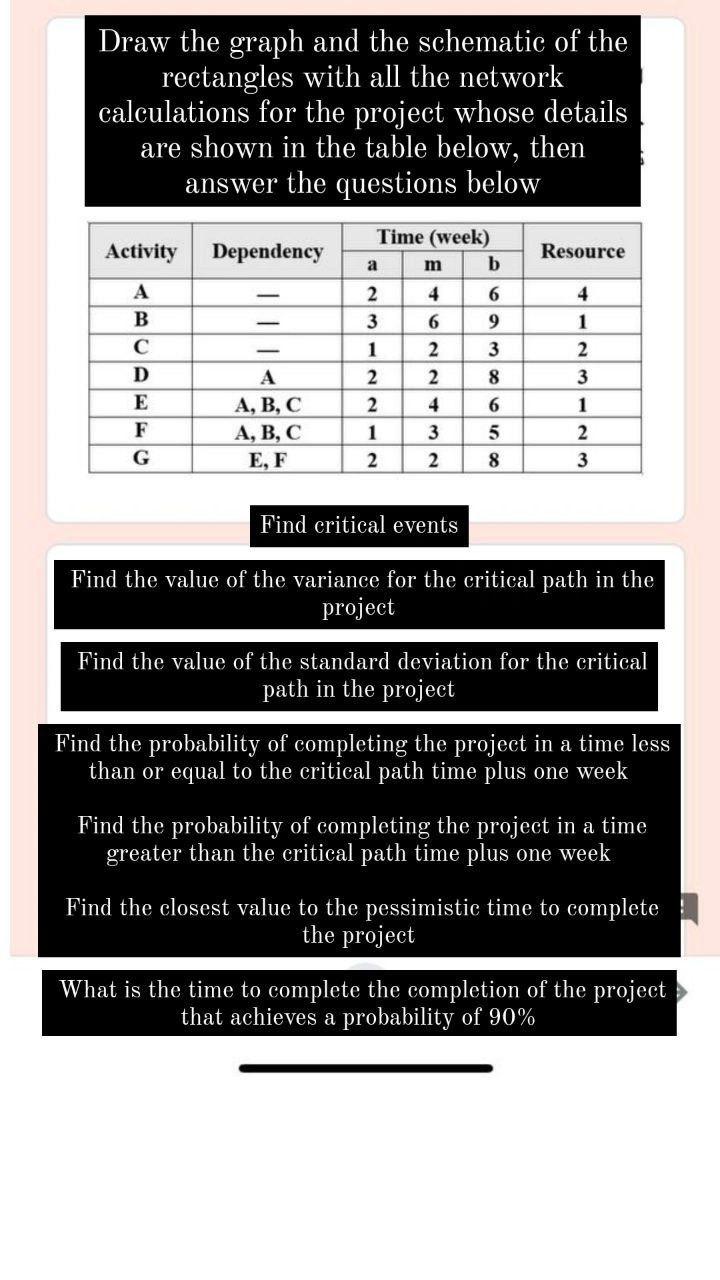
Step by Step Solution

There are 3 Steps involved in it

1 Expert Approved Answer
Step: 1 Unlock blur-text-image
Question Has Been Solved by an Expert!

Get step-by-step solutions from verified subject matter experts

Step: 2 Unlock
Step: 3 Unlock

Students Have Also Explored These Related General Management Questions!