

Question: Figure 1 shows a train of pulses, x(t). By using Fourier series analysis and MATLAB, plot x(t) for various values of N=1,10,100,1000, and 10000.
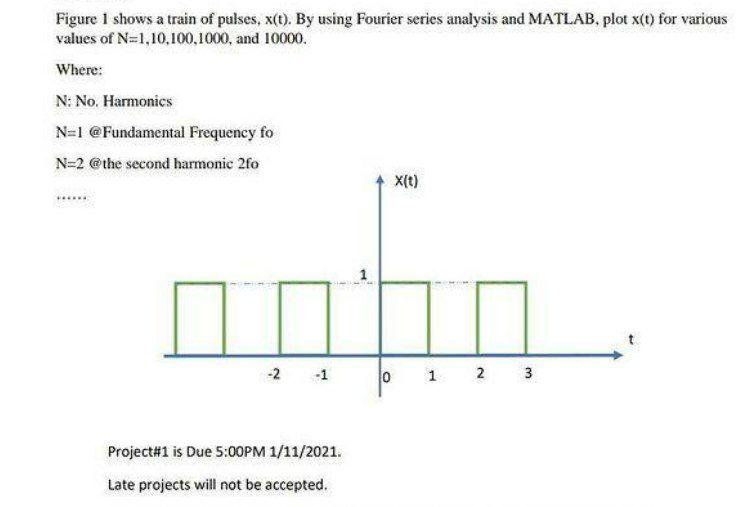
Figure 1 shows a train of pulses, x(t). By using Fourier series analysis and MATLAB, plot x(t) for various values of N=1,10,100,1000, and 10000. Where: N: No. Harmonics N=1 @Fundamental Frequency fo N=2 @the second harmonie 2fo X(t) -2 1 2 3 -1 Project#1 is Due 5:00PM 1/11/2021. Late projects will not be accepted.
Step by Step Solution
★★★★★
3.40 Rating (156 Votes )
There are 3 Steps involved in it
1 Expert Approved Answer
Step: 1 Unlock

MATLAB cod... View full answer
Question Has Been Solved by an Expert!
Get step-by-step solutions from verified subject matter experts
Step: 2 Unlock
Step: 3 Unlock