Question: I need the answer as soon as possible Please. Question 3 Life Data for 206 turbine disks at 100 hour intervals are given in the
I need the answer as soon as possible Please.
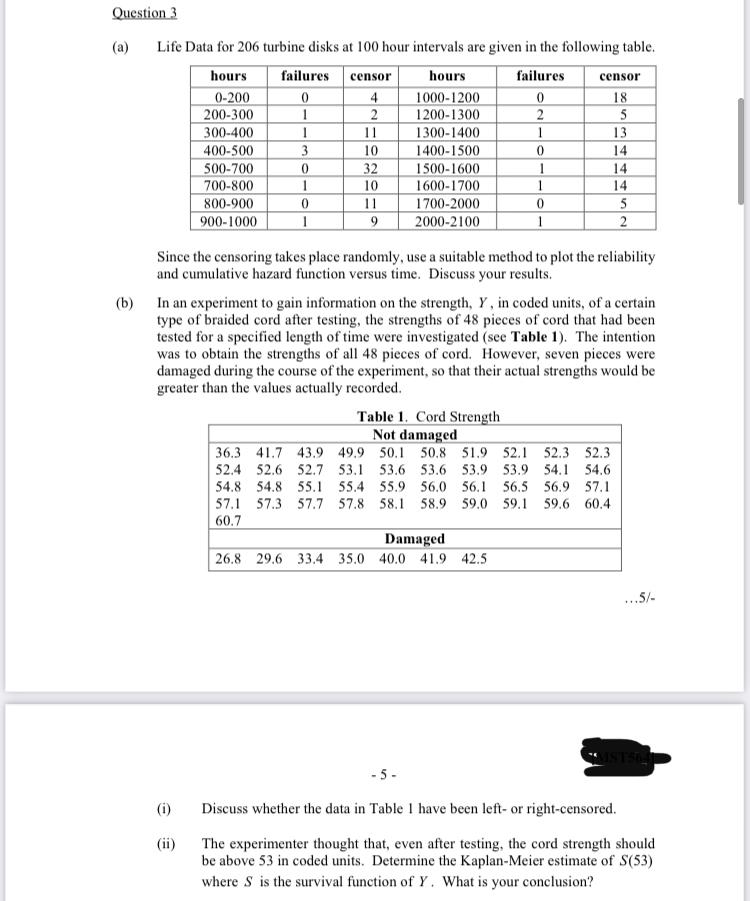
Question 3 Life Data for 206 turbine disks at 100 hour intervals are given in the following table. hours failures censor hours failures censor 0-200 0 4 1000-1200 0 18 200-300 1 2 1200-1300 2 5 300-400 1 11 1300-1400 1 13 400-500 3 10 1400-1500 0 14 500-700 0 32 1500-1600 1 14 700-800 1 10 1600-1700 1 14 800-900 11 1700-2000 0 5 900-1000 1 9 2000-2100 1 2 0 Since the censoring takes place randomly, use a suitable method to plot the reliability and cumulative hazard function versus time. Discuss your results. (b) In an experiment to gain information on the strength, Y, in coded units, of a certain type of braided cord after testing, the strengths of 48 pieces of cord that had been tested for a specified length of time were investigated (see Table 1). The intention was to obtain the strengths of all 48 pieces of cord. However, seven pieces were damaged during the course of the experiment, so that their actual strengths would be greater than the values actually recorded. Table 1. Cord Strength Not damaged 36.3 41.7 43.9 49.9 50.150.8 51.9 52.1 52.3 52.3 52.4 52.6 52.7 53.1 53.6 53.6 53.9 53.9 54.1 54.6 54.8 54.8 55.1 55.4 55.9 56.0 56.1 56.5 56.9 57.1 57.1 57.3 57.7 57.8 58.1 58.9 59.0 59.1 59.6 60.4 60.7 Damaged 26.8 29.6 33.4 35.0 40.0 41.9 42.5 ...5/- -5. () Discuss whether the data in Table I have been left- or right-censored. The experimenter thought that, even after testing, the cord strength should be above 53 in coded units. Determine the Kaplan-Meier estimate of S(53) where S is the survival function of Y. What is your conclusion? Question 3 Life Data for 206 turbine disks at 100 hour intervals are given in the following table. hours failures censor hours failures censor 0-200 0 4 1000-1200 0 18 200-300 1 2 1200-1300 2 5 300-400 1 11 1300-1400 1 13 400-500 3 10 1400-1500 0 14 500-700 0 32 1500-1600 1 14 700-800 1 10 1600-1700 1 14 800-900 11 1700-2000 0 5 900-1000 1 9 2000-2100 1 2 0 Since the censoring takes place randomly, use a suitable method to plot the reliability and cumulative hazard function versus time. Discuss your results. (b) In an experiment to gain information on the strength, Y, in coded units, of a certain type of braided cord after testing, the strengths of 48 pieces of cord that had been tested for a specified length of time were investigated (see Table 1). The intention was to obtain the strengths of all 48 pieces of cord. However, seven pieces were damaged during the course of the experiment, so that their actual strengths would be greater than the values actually recorded. Table 1. Cord Strength Not damaged 36.3 41.7 43.9 49.9 50.150.8 51.9 52.1 52.3 52.3 52.4 52.6 52.7 53.1 53.6 53.6 53.9 53.9 54.1 54.6 54.8 54.8 55.1 55.4 55.9 56.0 56.1 56.5 56.9 57.1 57.1 57.3 57.7 57.8 58.1 58.9 59.0 59.1 59.6 60.4 60.7 Damaged 26.8 29.6 33.4 35.0 40.0 41.9 42.5 ...5/- -5. () Discuss whether the data in Table I have been left- or right-censored. The experimenter thought that, even after testing, the cord strength should be above 53 in coded units. Determine the Kaplan-Meier estimate of S(53) where S is the survival function of Y. What is your conclusion


