

Question: I need the answer as soon as possible Use python to plot a histogram of total_bill and another histogram compare total_bil and tip. Instruction: import
I need the answer as soon as possible 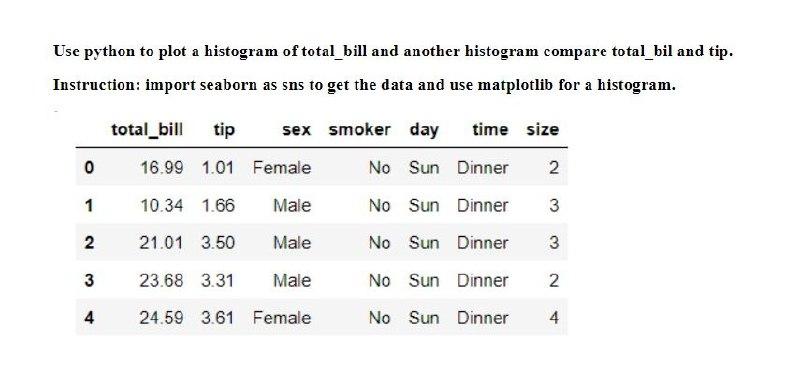
Use python to plot a histogram of total_bill and another histogram compare total_bil and tip. Instruction: import seaborn as sns to get the data and use matplotlib for a histogram. 0 total_bill tip sex smoker day time size 16.99 1.01 Female No Sun Dinner 2 10.34 1.66 Male No Sun Dinner 3 1 2 21.01 3.50 Male No Sun Dinner 3 3 23.68 3.31 Male No Sun Dinner 2 4 24.59 3.61 Female No Sun Dinner 4
Step by Step Solution
There are 3 Steps involved in it
1 Expert Approved Answer
Step: 1 Unlock

Question Has Been Solved by an Expert!
Get step-by-step solutions from verified subject matter experts
Step: 2 Unlock
Step: 3 Unlock