

Question: i need the answer for this math problem ExamView - ch5.tst 1 / 8 C: Name: Class: Date: ID: A FOM Ch 5 Statistics Multiple
i need the answer for this math problem
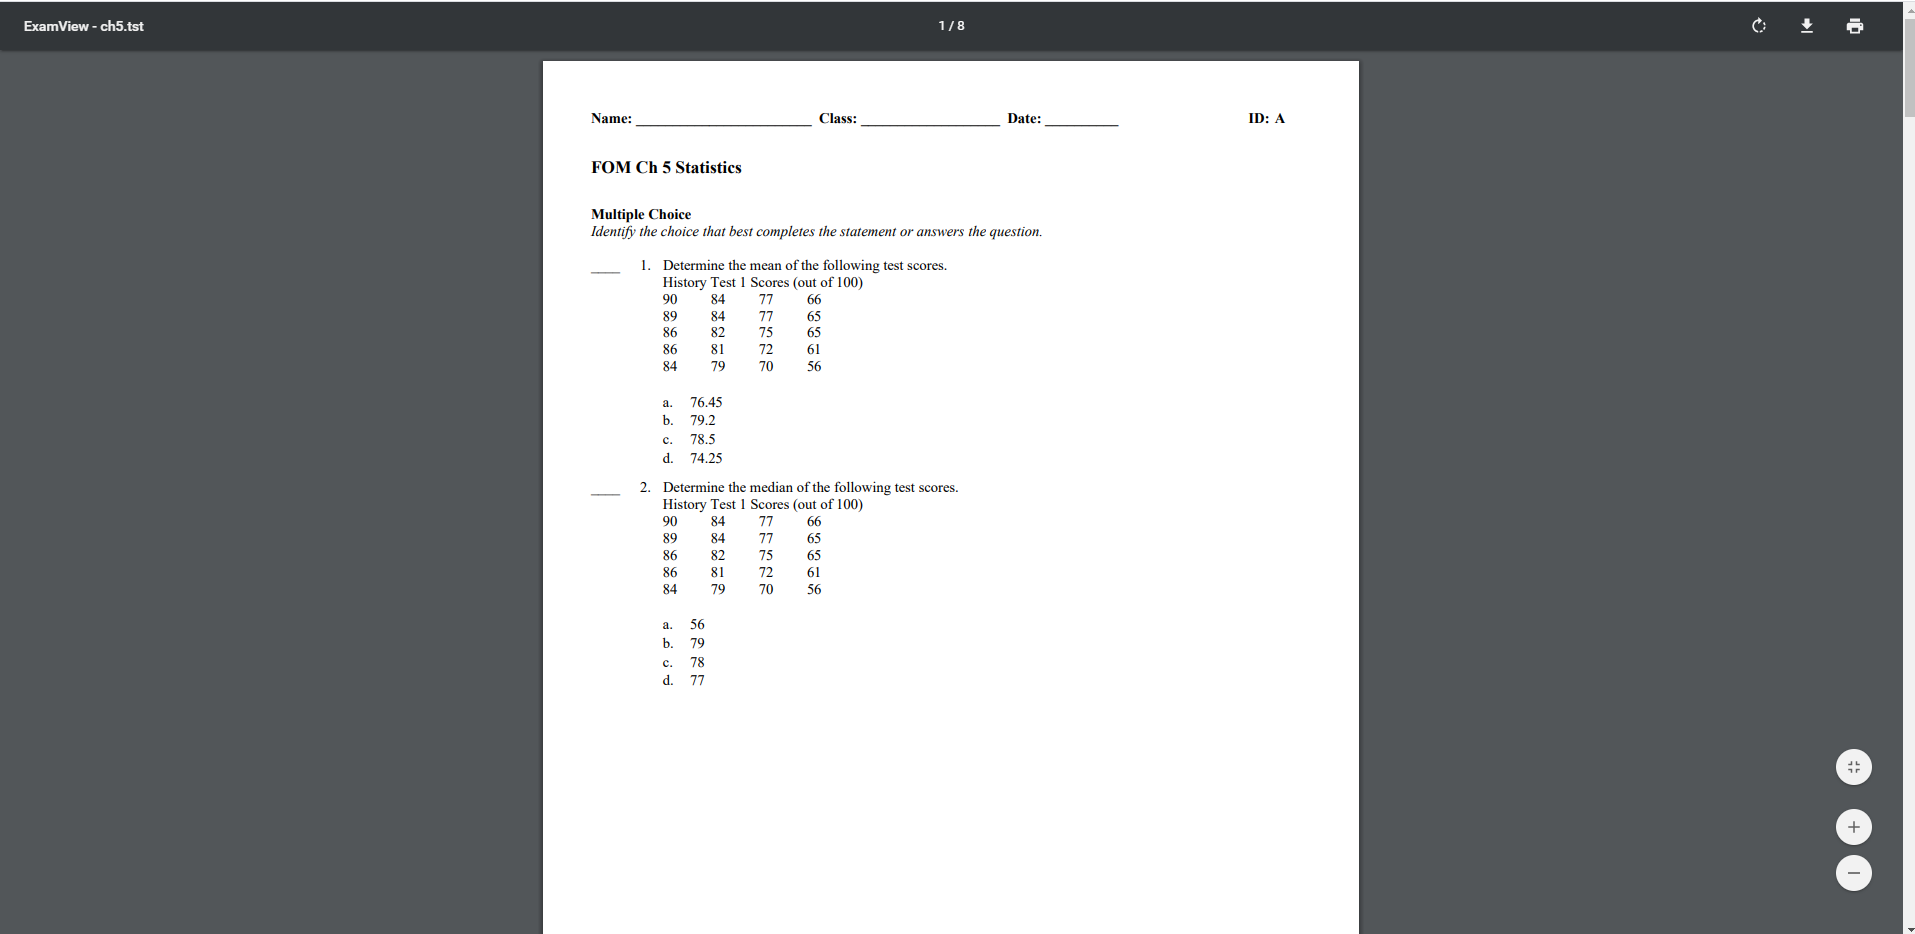
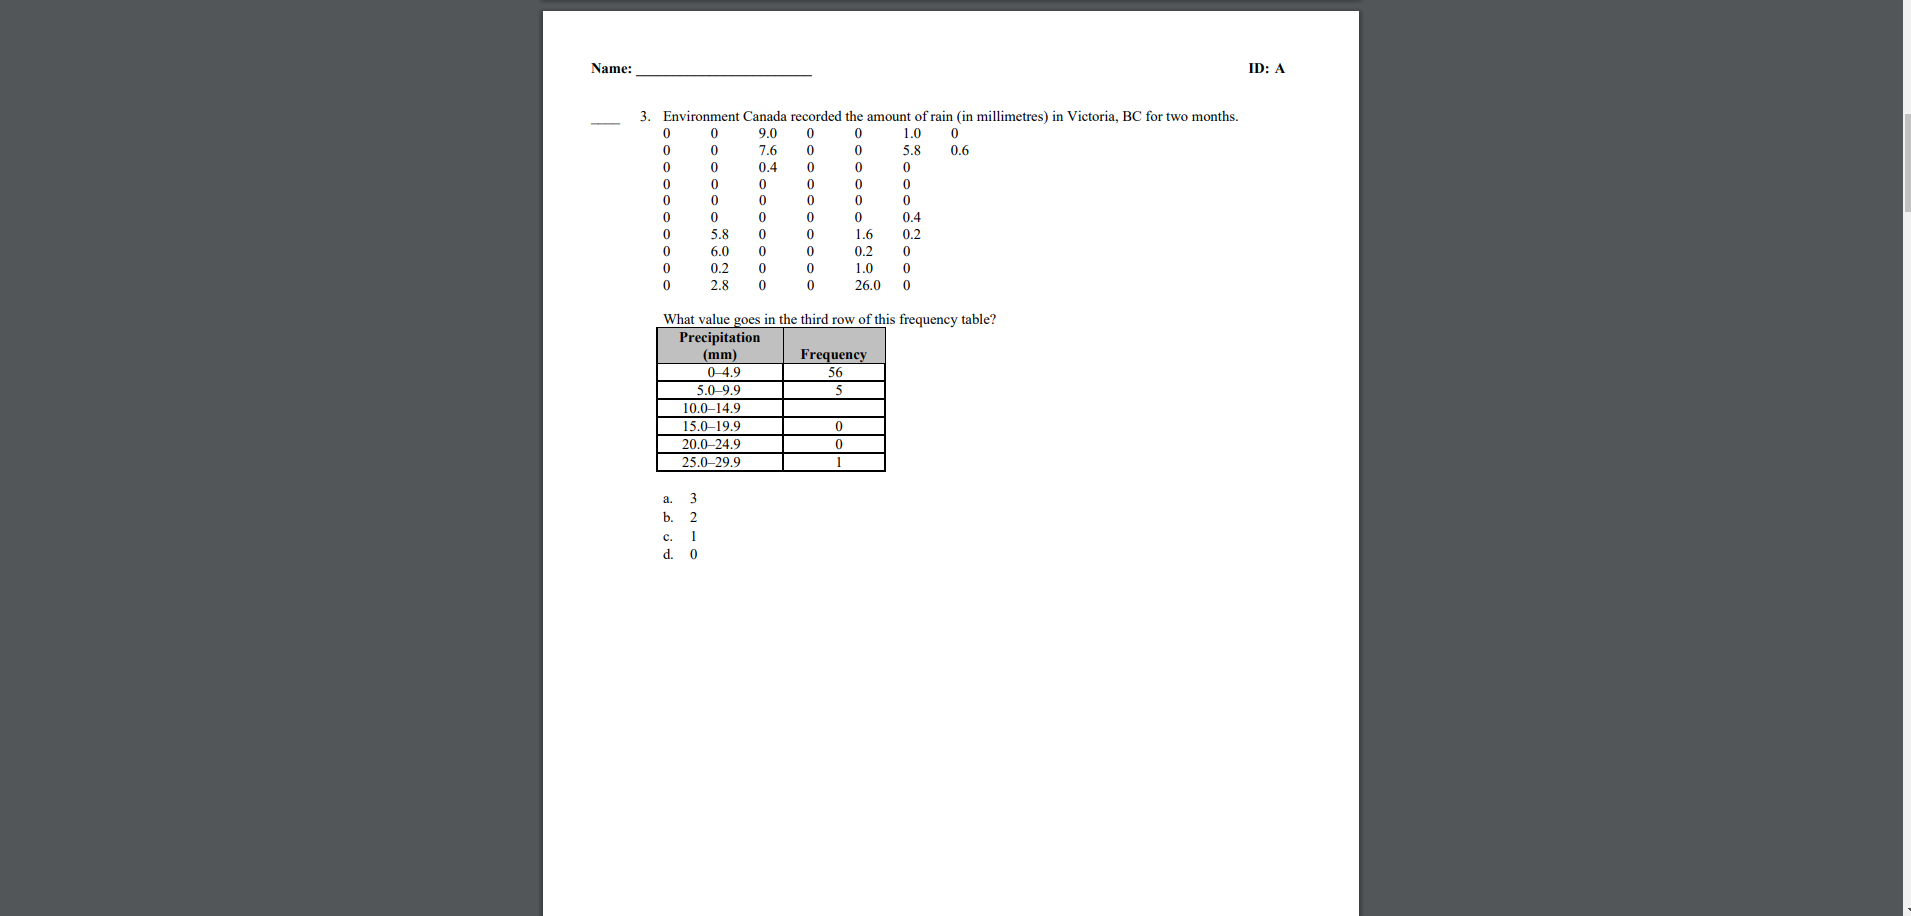
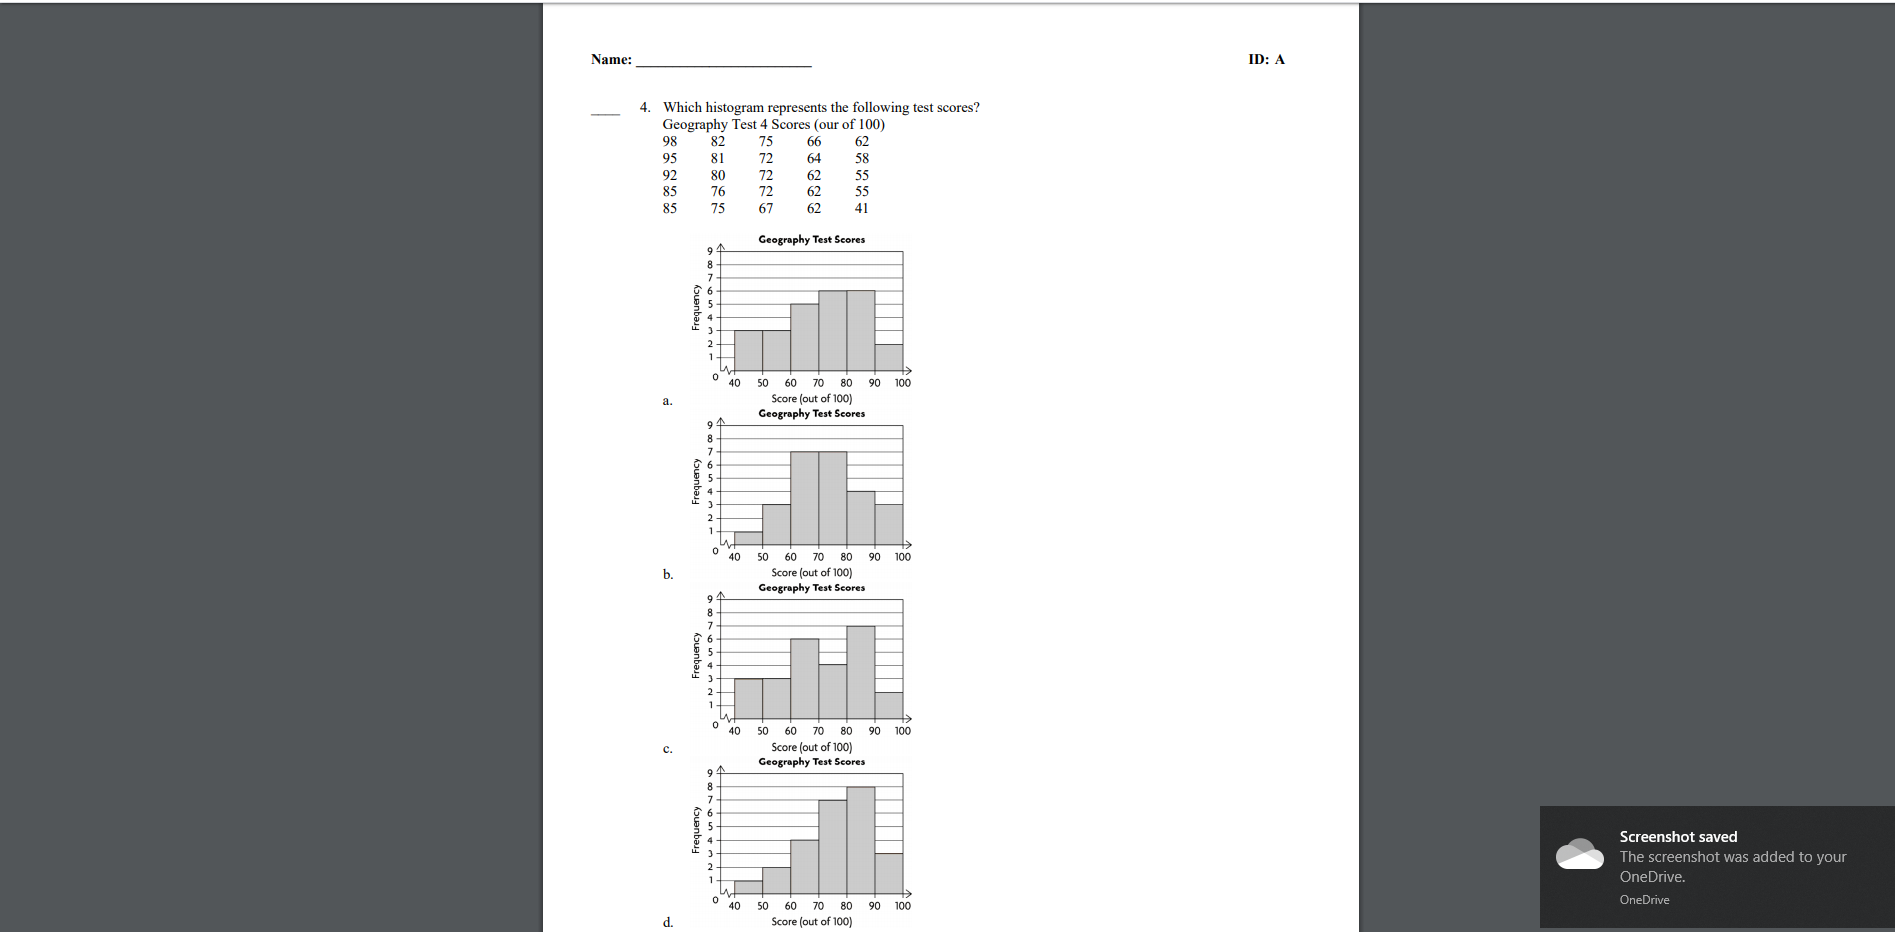
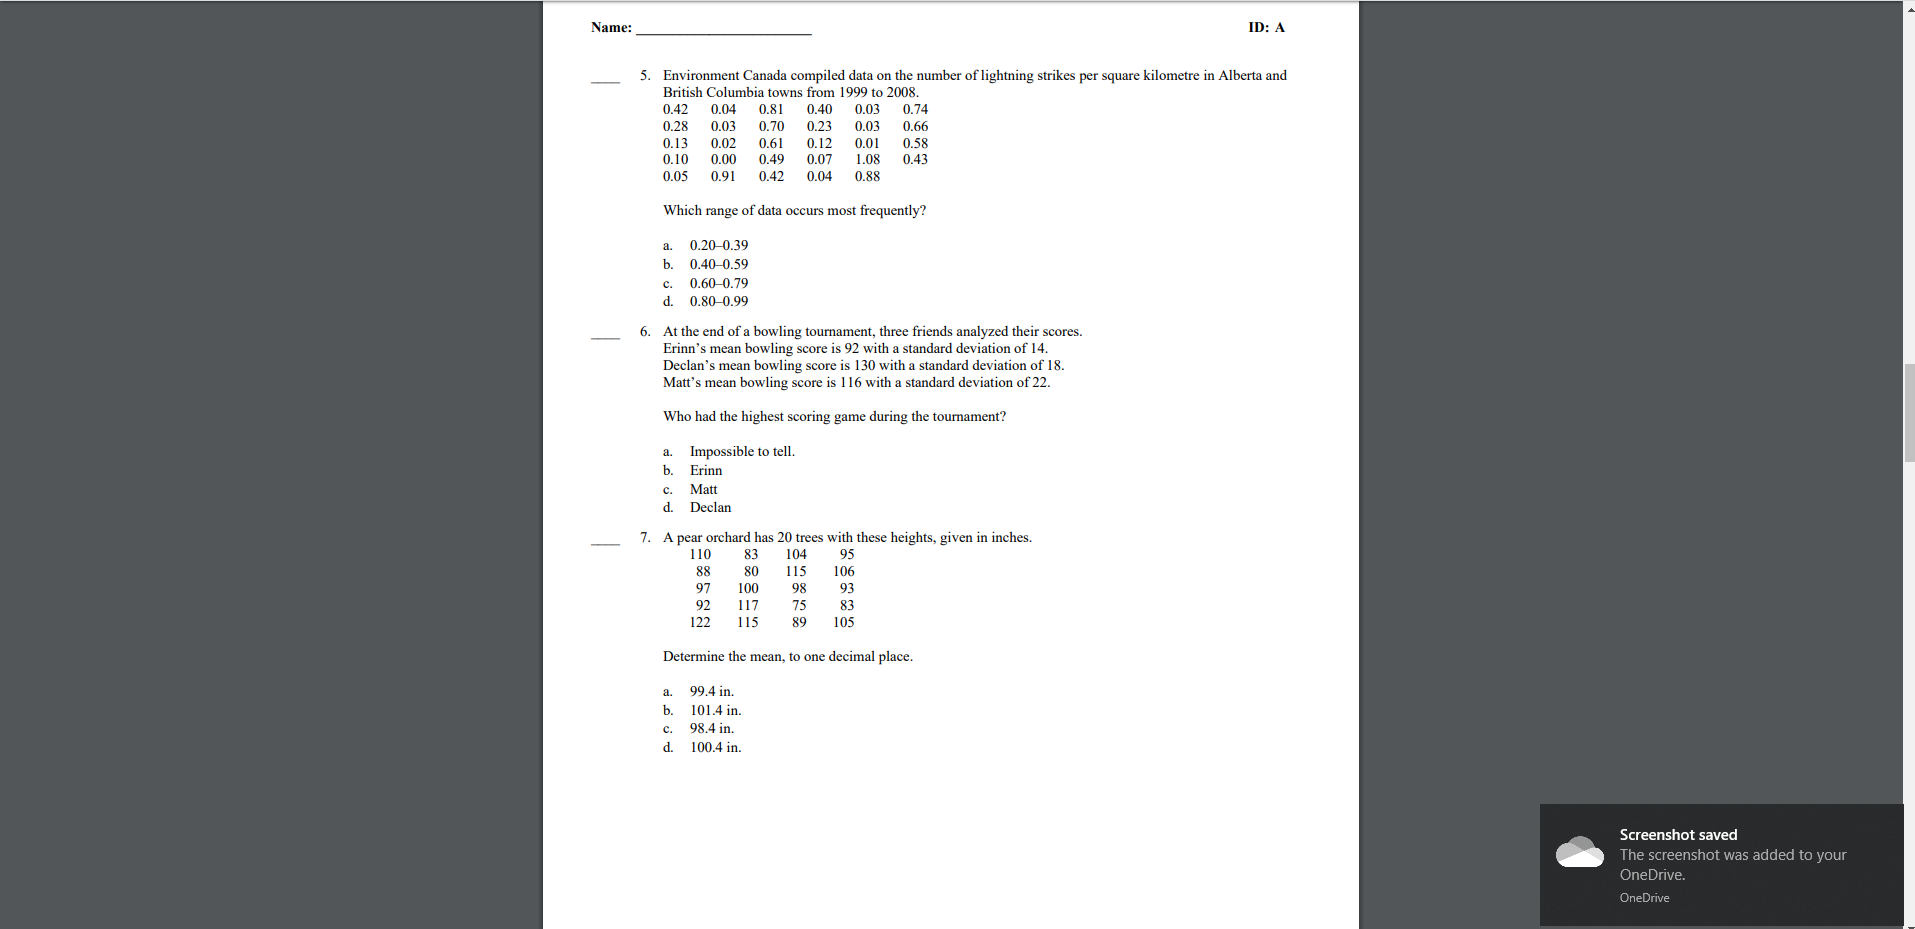
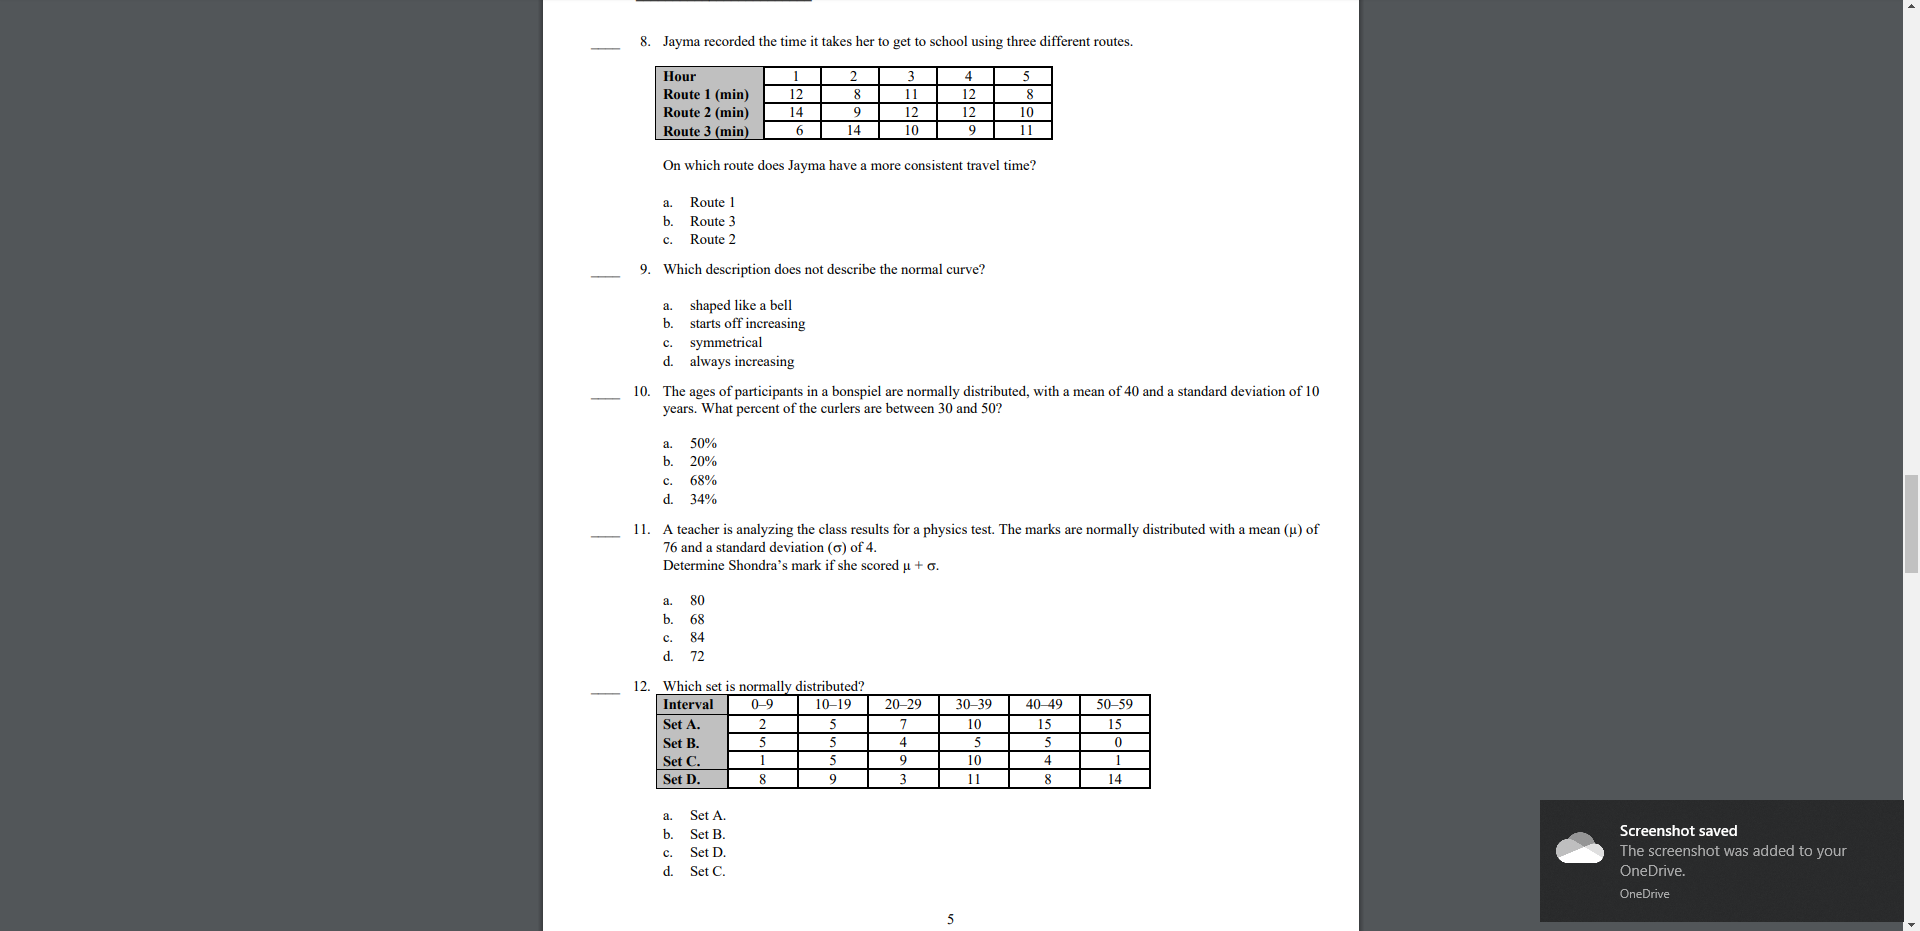
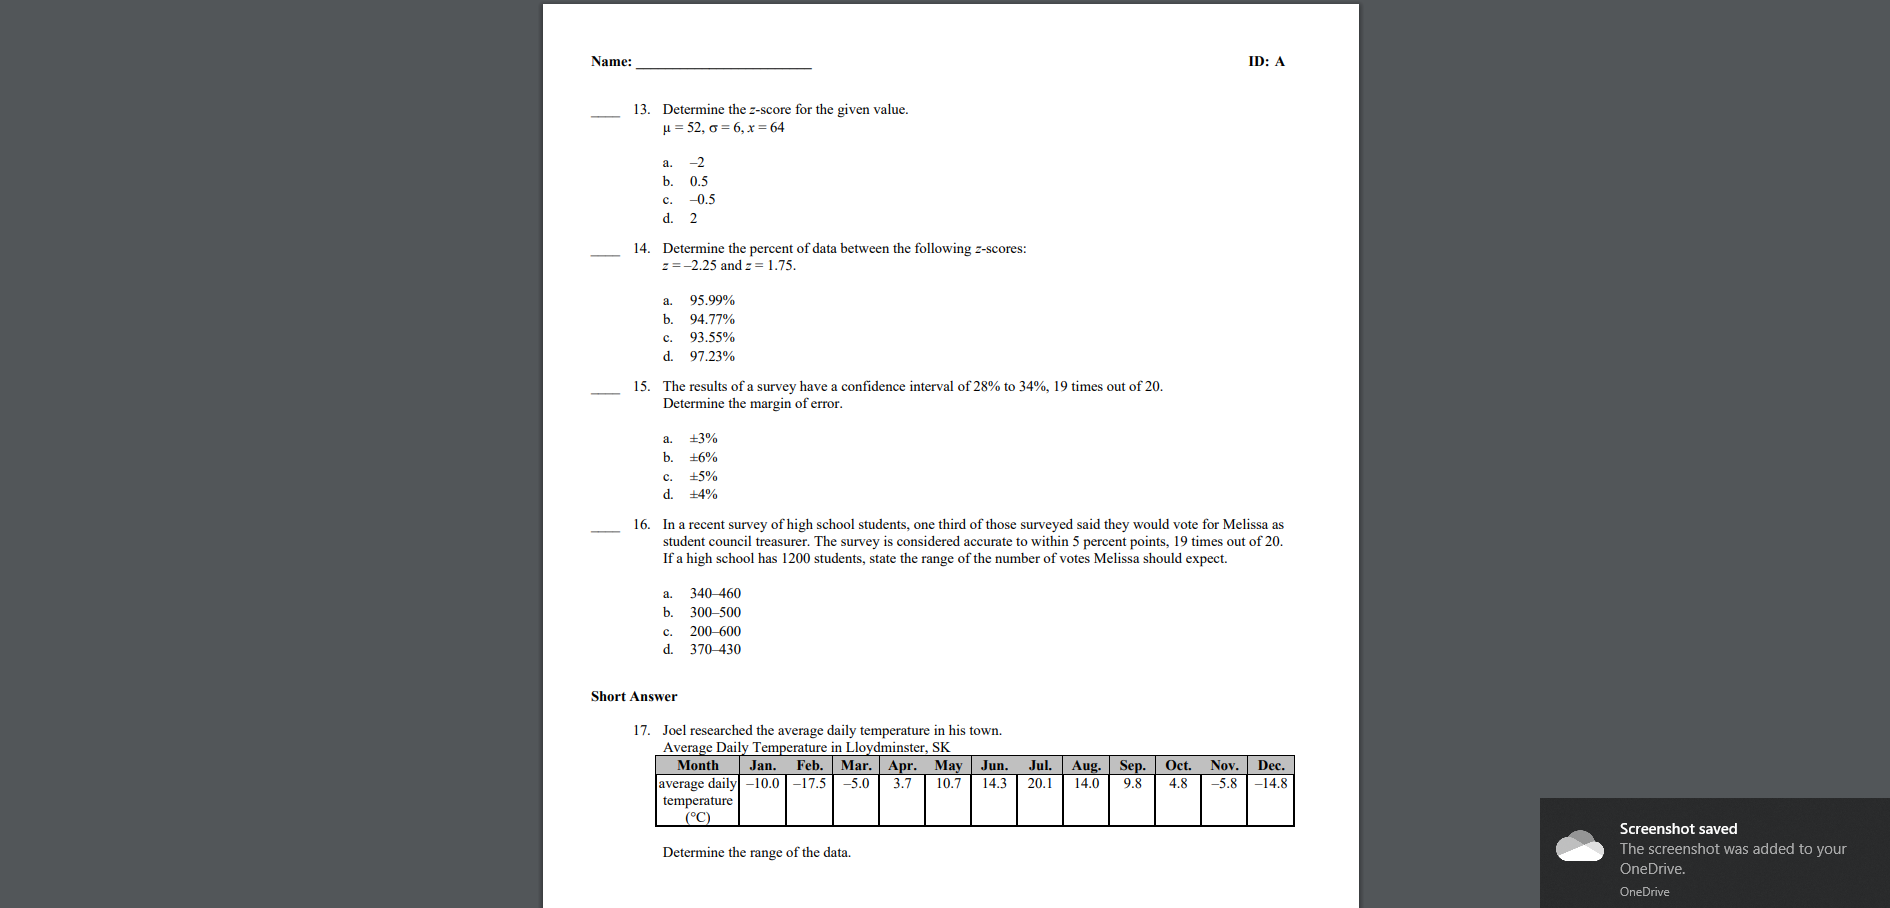
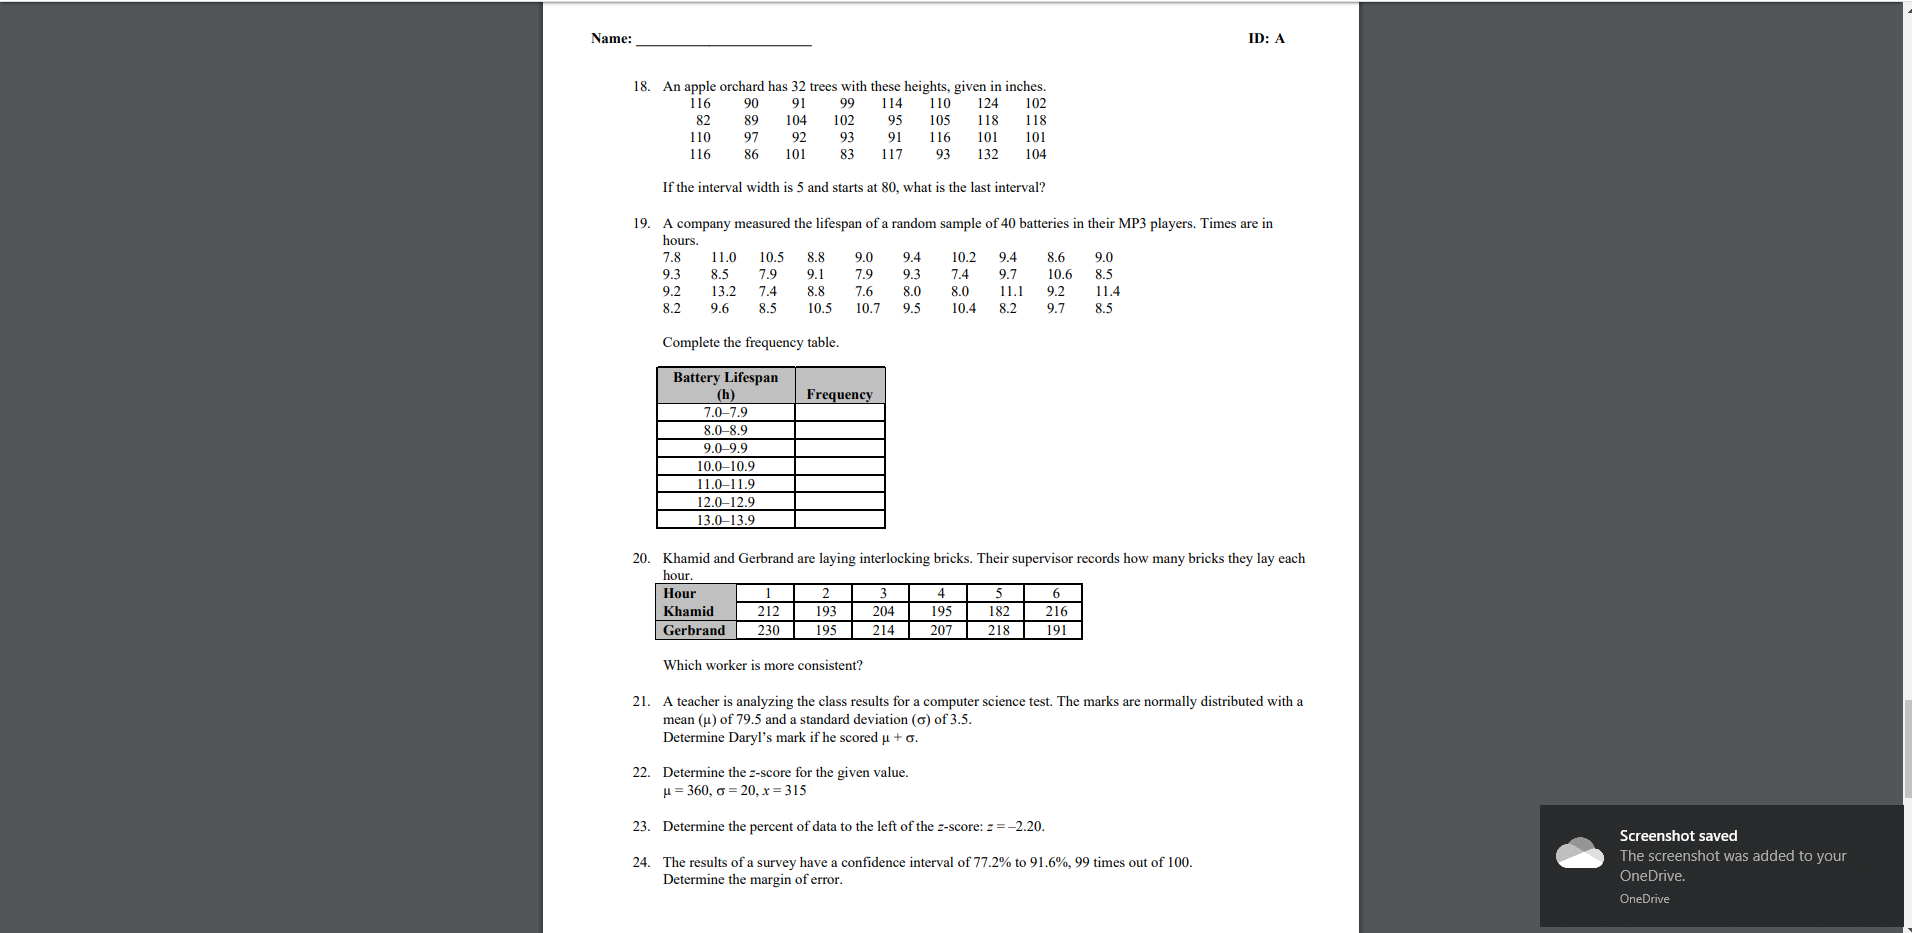
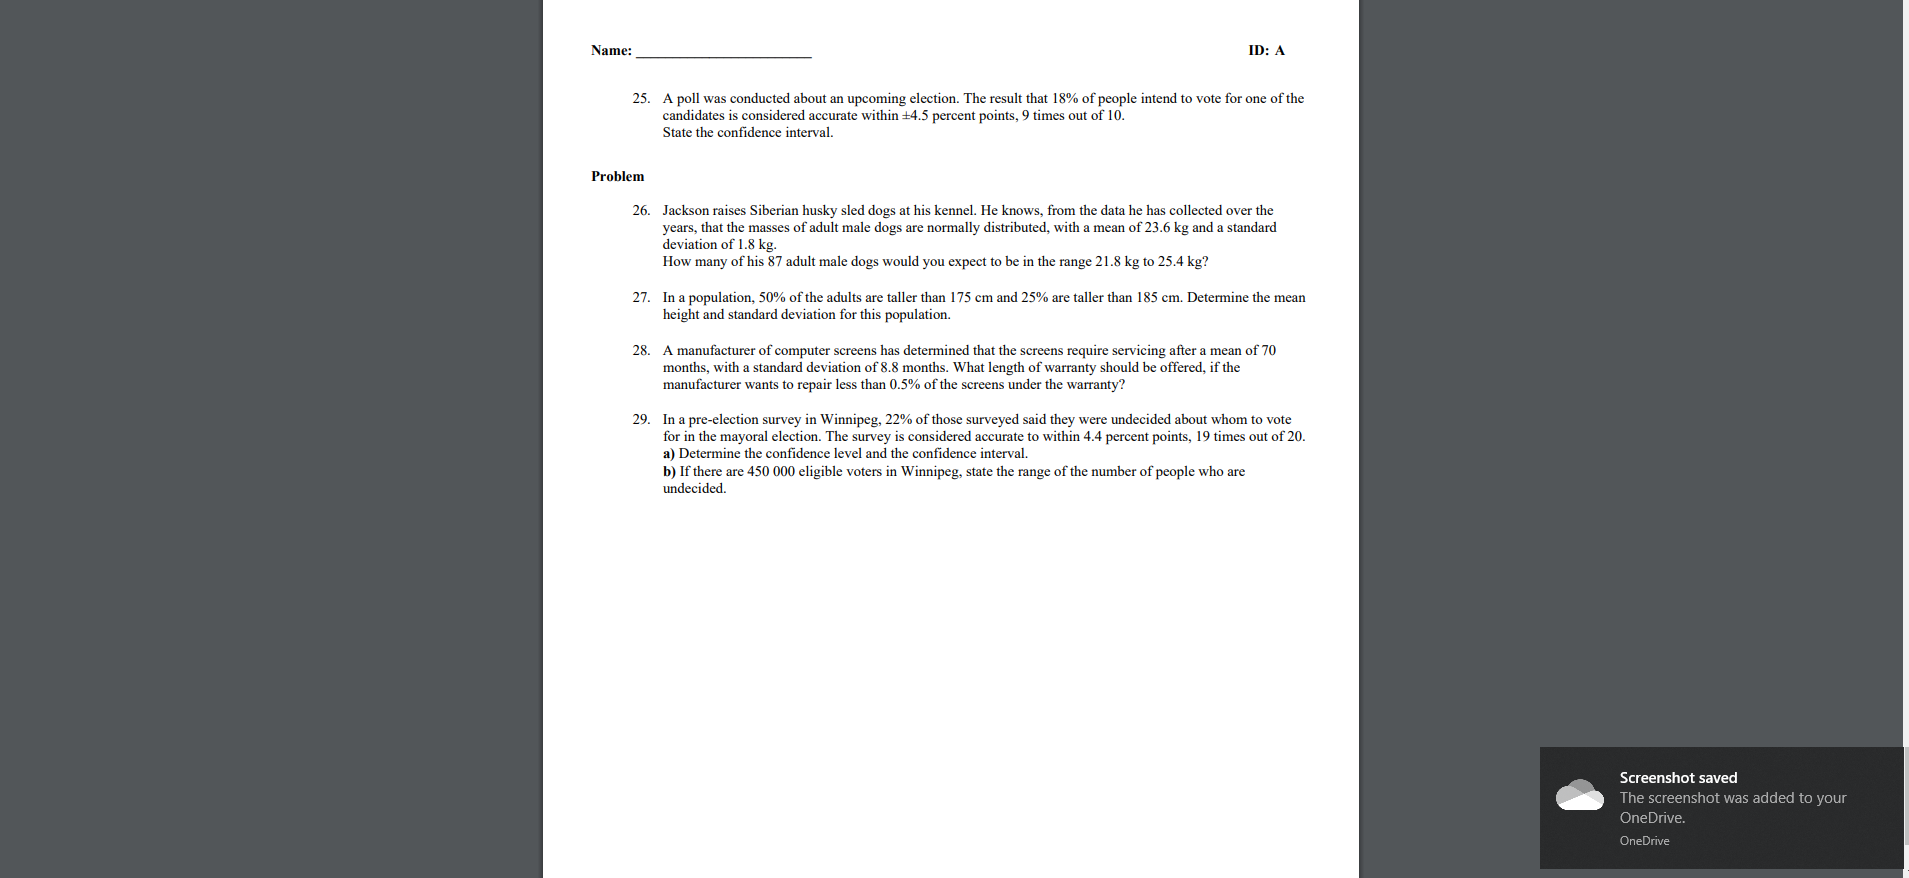
ExamView - ch5.tst 1 / 8 C: Name: Class: Date: ID: A FOM Ch 5 Statistics Multiple Choice Identify the choice that best completes the statement or answers the question. 1. Determine the mean of the following test scores. History Test 1 Scores (out of 100) 90 84 77 66 89 84 77 65 86 82 75 65 86 81 72 61 84 79 70 56 a. 76.45 b. 79.2 c. 78.5 d. 74.25 2. Determine the median of the following test scores. History Test 1 Scores (out of 100) 90 34 66 65 86 86 70 61 84 72 56 a. +Name: ID: A . Environment Canada recorded the amount of rain (in millimetres) in Victoria, BC for two months. 0 9.0 1.0 0 0.6 0.4 0 0 0 0 0 0.4 5.8 Doo 1.6 0.2 6.0 0.2 0 0.2 1.0 0 78 26.0 0 What value goes in the third row of this frequency table? Precipitation (mm) Frequency 0 4.9 56 5.0-9.9 10.0-14.9 5.0-19.9 20.0-24.9 0 25.0-29.9 O -NWName: ID: A 4. Which histogram represents the following test scores? Geography Test 4 Scores (our of 100) 98 82 62 95 81 66 80 85 75 Geography Test Scores Frequency 50 60 70 80 90 100 a. Score (out of 100) Geography Test Scores Frequency 40 50 60 70 80 100 b Score (out of 100) -NWAMONOD Geography Test Scores Frequency 50 60 70 80 90 100 C. Score (out of 100) -NWAMONO Geography Test Scores Frequency Screenshot saved The screenshot was added to your OneDrive. O 50 60 70 80 90 100 OneDrive d. Score (out of 100)Name: ID: A . Environment Canada compiled data on the number of lightning strikes per square kilometre in Alberta and British Columbia towns from 1999 to 2008. 0.42 0.04 0.81 0.40 0.03 0.74 0.28 0.03 0.70 0.23 0.03 0.66 0.13 0.02 0.61 0.12 0.01 0.58 0.10 0.00 0.49 0.07 1.08 0.43 0.05 0.91 0.42 0.04 0.88 Which range of data occurs most frequently? a. 0.20 0.39 b. 0.40-0.59 c. 0.60-0.79 d. 0.80-0.99 6. At the end of a bowling tournament, three friends analyzed their scores. Erinn's mean bowling score is 92 with a standard deviation of 14. Declan's mean bowling score is 130 with a standard deviation of 18. Matt's mean bowling score is 116 with a standard deviation of 22. Who had the highest scoring game during the tournament? Impossible to tell. b. Erinn C. Matt d. Declan 7. A pear orchard has 20 trees with these heights, given in inches. 110 83 104 95 88 80 115 106 97 100 98 93 92 117 75 83 122 115 89 105 Determine the mean, to one decimal place. a. 99.4 in. b. 101.4 in. C. 98.4 in. d. 100.4 in. Screenshot saved The screenshot was added to your OneDrive. OneDrive8. Jayma recorded the time it takes her to get to school using three different routes. Hour Route 1 (min) Route 2 (min) Route 3 (min) On which route does Jayma have a more consistent travel time? Route 1 b. Route 3 c. Route 2 9. Which description does not describe the normal curve? a. shaped like a bell b. starts off increasing C. symmetrical d. always increasing 10. The ages of participants in a bonspiel are normally distributed, with a mean of 40 and a standard deviation of 10 years. What percent of the curlers are between 30 and 50? a. 50% b. 20% C. 68% d. 34% 11. A teacher is analyzing the class results for a physics test. The marks are normally distributed with a mean (u) of 76 and a standard deviation (6) of 4. Determine Shondra's mark if she scored u + o. a. 80 68 C. 84 d 72 12. Which set is normally distributed? Interval 0 9 10-19 20-29 30-39 40-49 50-59 Set A 10 15 15 Set B. Set C 9 9 10 4 -el Set D. 11 14 a. Set A. b. Set B. Screenshot saved C. Set D. The screenshot was added to your d. Set C. OneDrive. OneDriveName: ID: A 13. Determine the z-score for the given value. H = 52, 6=6, x = 64 a. -2 b. 0.5 C. 0.5 d. 2 14. Determine the percent of data between the following z-scores: z =-2.25 and z = 1.75. a. 95.99% b. 94.77% C. 93.55% d 97.23% 15. The results of a survey have a confidence interval of 28% to 34%, 19 times out of 20. Determine the margin of error. a. +3% b. C. +5% d 14% 16. In a recent survey of high school students, one third of those surveyed said they would vote for Melissa as student council treasurer. The survey is considered accurate to within 5 percent points, 19 times out of 20. If a high school has 1200 students, state the range of the number of votes Melissa should expect. a. 340-460 b. 300-500 C. 200-600 d 370-430 Short Answer 17. Joel researched the average daily temperature in his town. Average Daily Temperature in Lloydminster, SK Month Jan. Feb. Mar. Apr. May Jul. Aug. Sep. Oct. Nov. Dec. average daily -10.0 -17.5 -5.0 3.7 10.7 14.3 20.1 14.0 9.8 4.8 -5.8 -14.8 temperature ( C) Screenshot saved Determine the range of the data. The screenshot was added to your OneDrive. OneDriveName: ID: A 18. An apple orchard has 32 trees with these heights, given in inches. 116 90 91 99 114 110 124 102 82 89 104 102 95 105 118 118 110 97 92 93 91 116 101 101 116 86 101 83 117 Q3 132 104 If the interval width is 5 and starts at 80, what is the last interval? 19. A company measured the lifespan of a random sample of 40 batteries in their MP3 players. Times are in hours. 7.8 11.0 10.5 8.8 9.0 9.4 10.2 9.4 8.6 9.0 93 8.5 7.9 91 7.9 9.3 74 97 10.6 8.5 9.2 13.2 7.4 8 8 7.6 8.0 8.0 11.1 9.2 11.4 8.2 9.6 85 10.5 10.7 9.5 10.4 8.2 9.7 8.5 Complete the frequency table. Battery Lifespan (h) Frequency .0 7.9 8.0 8. 9.0-9.9 10.0-10.9 1.0-11.9 12.0-12.9 13.0-13.9 20. Khamid and Gerbrand are laying interlocking bricks. Their supervisor records how many bricks they lay each hour. Hour Khamid Gerbrand Which worker is more consistent? 21. A teacher is analyzing the class results for a computer science test. The marks are normally distributed with a mean (u) of 79.5 and a standard deviation () of 3.5. Determine Daryl's mark if he scored u + o. 22. Determine the z-score for the given value. H = 360, 6 = 20, x = 315 23. Determine the percent of data to the left of the z-score: z =-2.20. Screenshot saved 24. The results of a survey have a confidence interval of 77.2% to 91.6%, 99 times out of 100. The screenshot was added to your Determine the margin of error. OneDrive. OneDriveName: ID: A 25. A poll was conducted about an upcoming election. The result that 18% of people intend to vote for one of the candidates is considered accurate within #4.5 percent points, 9 times out of 10. State the confidence interval. Problem 26. Jackson raises Siberian husky sled dogs at his kennel. He knows, from the data he has collected over the years, that the masses of adult male dogs are normally distributed, with a mean of 23.6 kg and a standard deviation of 1.8 kg. How many of his 87 adult male dogs would you expect to be in the range 21.8 kg to 25.4 kg? 27. In a population, 50% of the adults are taller than 175 cm and 25% are taller than 185 cm. Determine the mean height and standard deviation for this population. 28. A manufacturer of computer screens has determined that the screens require servicing after a mean of 70 months, with a standard deviation of 8.8 months. What length of warranty should be offered, if the manufacturer wants to repair less than 0.5% of the screens under the warranty? 29. In a pre-election survey in Winnipeg, 22% of those surveyed said they were undecided about whom to vote for in the mayoral election. The survey is considered accurate to within 4.4 percent points, 19 times out of 20. a) Determine the confidence level and the confidence interval. b) If there are 450 000 eligible voters in Winnipeg, state the range of the number of people who are undecided. Screenshot saved The screenshot was added to your OneDrive. OneDrive
Step by Step Solution
There are 3 Steps involved in it

Get step-by-step solutions from verified subject matter experts