Question: I need the answer to part 7 analysis Question (1) and (2) part 6 has been solved in another question Part (6) Question (1) https://www.chegg.com/homework-help/questions-and-answers/1-introduction-experiment-students-understand-construct-x-bar-r-charts-excel-2-objectives--q55602289?trackid=8qIjOwey
I need the answer to part 7 analysis
Question (1) and (2) part 6 has been solved in another question
Part (6) Question (1)
https://www.chegg.com/homework-help/questions-and-answers/1-introduction-experiment-students-understand-construct-x-bar-r-charts-excel-2-objectives--q55602289?trackid=8qIjOwey
Part (6) Question (2)
https://www.chegg.com/homework-help/questions-and-answers/1-introduction-experiment-students-understand-construct-x-bar-r-charts-excel-2-objectives--q55603456?trackid=8qIjOwey
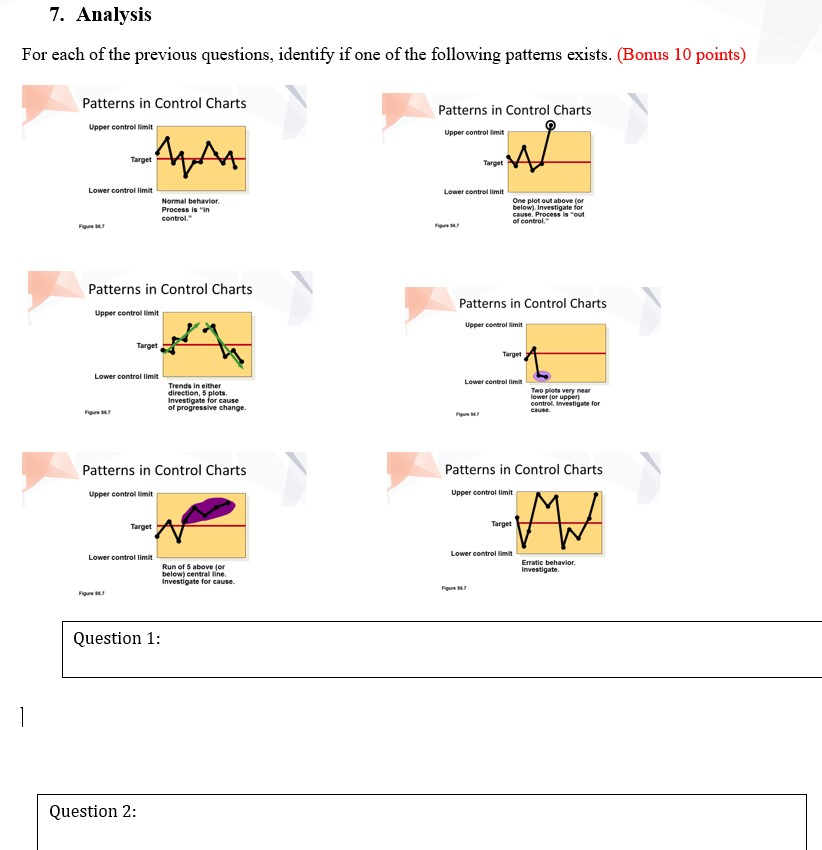 Type or paste question here
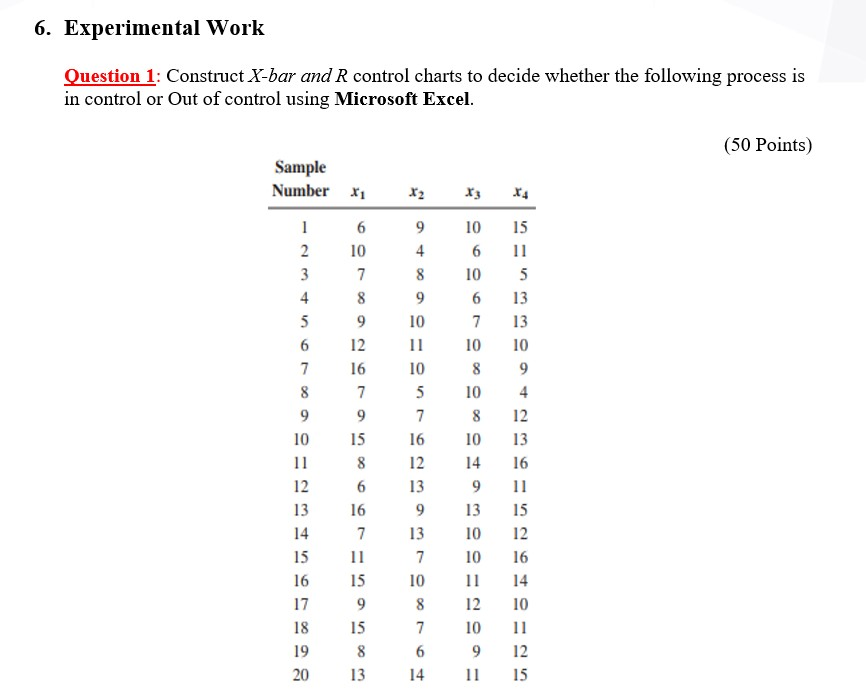
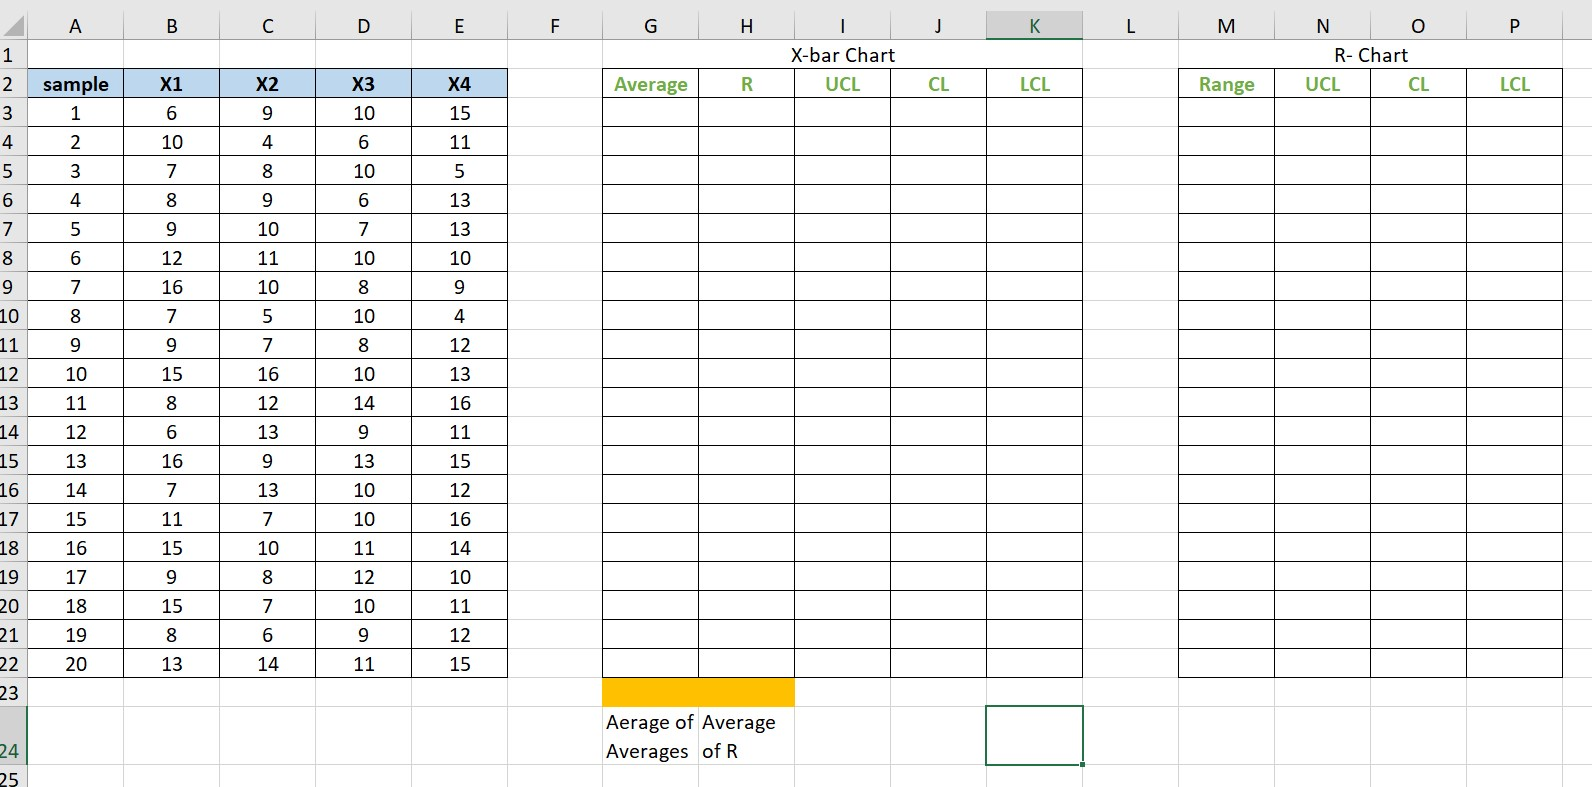
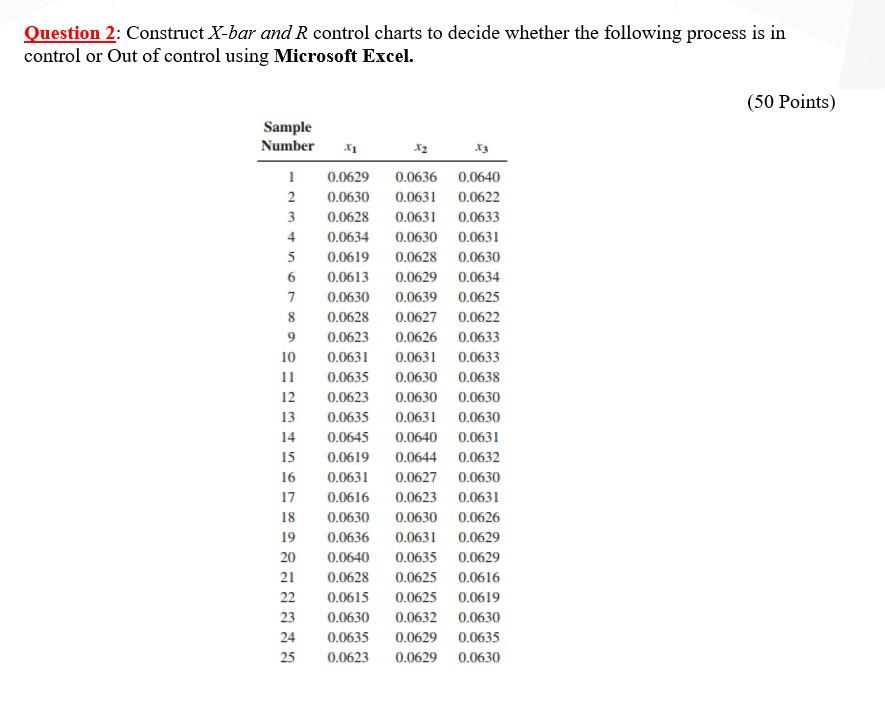
6. Experimental Work Question 1: Construct X-bar and R control charts to decide whether the following process is in control or Out of control using Microsoft Excel. (50 Points) Sample Number X1 X3 X4 9 4 8 9 10 16 2 10 3 7 4 8 5 9 6 12 7 16 8 7 9 9 10 15 11 8 12 6 13 16 14 7 15 11 16 15 17 9 18 15 19 8 20 13 10 6 10 6 7 10 8 10 8 10 14 9 13 10 10 11 12 10 9 11 15 11 5 13 13 10 9 4 12 13 16 10 5 7 16 12 13 9 13 7 15 12 16 14 10 10 8 7 6 14 12 15 A B C D E F G H J L M o P 1 I X-bar Chart UCL N R- Chart UCL CL 2 X1 X3 X4 Average R CL LCL Range sample 1 LCL X2 9 6 3 4 10 6 15 11 2 10 4 5 3 7 8 10 5 6 4 8 9 6 13 [ 5 9 10 7 13 7 8 9 6 11 10 10 12 16 7 10 8 9 10 5 4 8 9 7 9 11 7 12 900 93 12 10 15 16 13 11 8 12 16 13 14 15 12 6 13 9 11 13 16 9 13 15 16 14 7 13 10 12 17 15 11 7 10 16 18 16 15 11 14 19 17 9 900 N 12 10 20 15 10 11 18 19 21 6 9 12 22 20 13 14 11 15 23 Aerage of Average Averages of R 224 25 Question 2: Construct X-bar and R control charts to decide whether the following process is in control or Out of control using Microsoft Excel. (50 Points) Sample Number 1 2 3 4 5 6 7 8 9 10 12 13 0.0629 0.0630 0.0628 0.0634 0.0619 0.0613 0.0630 0.0628 0.0623 0.0631 0.0635 0.0623 0.0635 0.0645 0.0619 0.0631 0.0616 0.0630 0.0636 0.0640 0.0628 0.0615 0.0630 0.0635 0.0623 0.0636 0.0640 0.0631 0.0622 0.0631 0.0633 0.0630 0.0631 0.0628 0.0630 0.0629 0.0634 0.0639 0.0625 0.0627 0.0622 0.0626 0.0633 0.0631 0.0633 0.0630 0.0638 0.0630 0.0630 0.0631 0.0630 0.0640 0.0631 0.0644 0.0632 0.0627 0.0630 0.0623 0.0631 0.0630 0.0626 0.0631 0.0629 0.0635 0.0629 0.0625 0.0616 0.0625 0.0619 0.0632 0.0630 0.0629 0.0635 0.0629 0.0630 14 15 16 17 18 19 20 21 22 23 24 25 7. Analysis For each of the previous questions, identify if one of the following patterns exists. (Bonus 10 points) Patterns in Control Charts Patterns in Control Charts Upper controllimit Upper controllimit Target Target Lower controllimit Lower controllimit Normal behavior Process is in control One plot out above (or below). Investigate for Gause. Process is out of control Figure Patterns in Control Charts Patterns in Control Charts Upper controllimit Upper controllimit Target Target Lower controllimit Lower controllimit Trends in either direction, 5 plots. Investigate for cause of progressive change. Two plats very near lower for upper) control. Investigate for Patterns in Control Charts Patterns in Control Charts Upper controllimit Upper controllimit Target Target ww Lower controllimit Lower controllimit Erratic behavior. Investigate Run of 5 above (or below) central line Investigate for cause Fe Question 1: 1 Question 2: 6. Experimental Work Question 1: Construct X-bar and R control charts to decide whether the following process is in control or Out of control using Microsoft Excel. (50 Points) Sample Number X1 X3 X4 9 4 8 9 10 16 2 10 3 7 4 8 5 9 6 12 7 16 8 7 9 9 10 15 11 8 12 6 13 16 14 7 15 11 16 15 17 9 18 15 19 8 20 13 10 6 10 6 7 10 8 10 8 10 14 9 13 10 10 11 12 10 9 11 15 11 5 13 13 10 9 4 12 13 16 10 5 7 16 12 13 9 13 7 15 12 16 14 10 10 8 7 6 14 12 15 A B C D E F G H J L M o P 1 I X-bar Chart UCL N R- Chart UCL CL 2 X1 X3 X4 Average R CL LCL Range sample 1 LCL X2 9 6 3 4 10 6 15 11 2 10 4 5 3 7 8 10 5 6 4 8 9 6 13 [ 5 9 10 7 13 7 8 9 6 11 10 10 12 16 7 10 8 9 10 5 4 8 9 7 9 11 7 12 900 93 12 10 15 16 13 11 8 12 16 13 14 15 12 6 13 9 11 13 16 9 13 15 16 14 7 13 10 12 17 15 11 7 10 16 18 16 15 11 14 19 17 9 900 N 12 10 20 15 10 11 18 19 21 6 9 12 22 20 13 14 11 15 23 Aerage of Average Averages of R 224 25 Question 2: Construct X-bar and R control charts to decide whether the following process is in control or Out of control using Microsoft Excel. (50 Points) Sample Number 1 2 3 4 5 6 7 8 9 10 12 13 0.0629 0.0630 0.0628 0.0634 0.0619 0.0613 0.0630 0.0628 0.0623 0.0631 0.0635 0.0623 0.0635 0.0645 0.0619 0.0631 0.0616 0.0630 0.0636 0.0640 0.0628 0.0615 0.0630 0.0635 0.0623 0.0636 0.0640 0.0631 0.0622 0.0631 0.0633 0.0630 0.0631 0.0628 0.0630 0.0629 0.0634 0.0639 0.0625 0.0627 0.0622 0.0626 0.0633 0.0631 0.0633 0.0630 0.0638 0.0630 0.0630 0.0631 0.0630 0.0640 0.0631 0.0644 0.0632 0.0627 0.0630 0.0623 0.0631 0.0630 0.0626 0.0631 0.0629 0.0635 0.0629 0.0625 0.0616 0.0625 0.0619 0.0632 0.0630 0.0629 0.0635 0.0629 0.0630 14 15 16 17 18 19 20 21 22 23 24 25 7. Analysis For each of the previous questions, identify if one of the following patterns exists. (Bonus 10 points) Patterns in Control Charts Patterns in Control Charts Upper controllimit Upper controllimit Target Target Lower controllimit Lower controllimit Normal behavior Process is in control One plot out above (or below). Investigate for Gause. Process is out of control Figure Patterns in Control Charts Patterns in Control Charts Upper controllimit Upper controllimit Target Target Lower controllimit Lower controllimit Trends in either direction, 5 plots. Investigate for cause of progressive change. Two plats very near lower for upper) control. Investigate for Patterns in Control Charts Patterns in Control Charts Upper controllimit Upper controllimit Target Target ww Lower controllimit Lower controllimit Erratic behavior. Investigate Run of 5 above (or below) central line Investigate for cause Fe Question 1: 1 Question 2


