

Question: i need the answer to the second question only and it is due in 6 hours. Note: Write a brief definition for each (mean, std

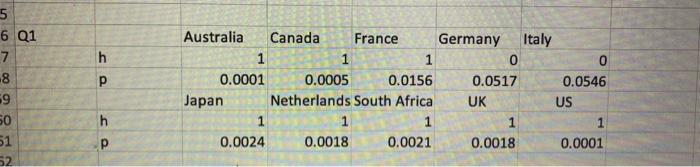
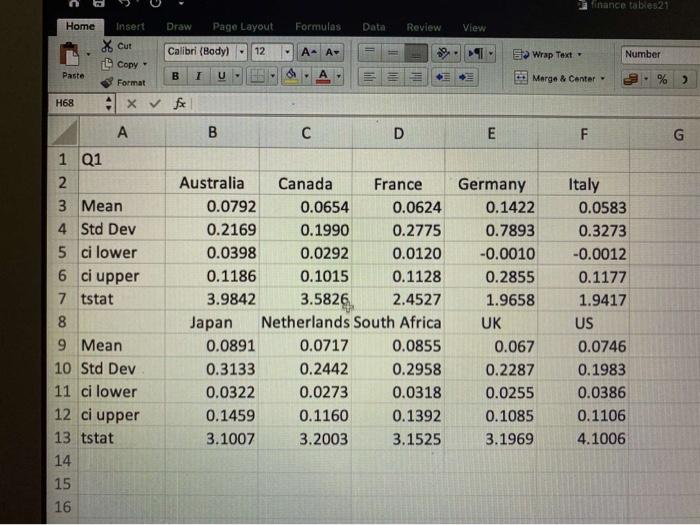
Problem Set Questions All questions about the relevant Matlab commands should be directed to Martin and Donald who will provide support in the Matlab commands. During the computing lab sessions you can work through the Matlab workbook and do the problem set questions and also receive feedback on your answers. It is important that you use this opportunity to receive informal feedback on your initial attempt at the problem set and how you can incorporate that feedback in improving your performance. The data for the problem set questions are in the project.xlsx file. This file contains the annual S returns of a number of equity markets around the world between 1901 and 2019. The file also contains the annual returns of U.S. Treasury Bills over the same period. The data is the Dimson, Nagel and Staunton historical returns database which is available through Momingstar Direct. Your group is required to select 10 different markets for your empirical analysis, which is your choice. You will also need the U.S. Treasury Bill returns to calculate the annual excess returns for each market in questions 1 and 3. As the data is in % terms, divide all the data by 100 to work in decimals. 1. For each of your markets, calculate the average excess returns, standard deviation, and the I-statistic of the null hypothesis that the average excess market return equals zero across the whole sample period. In addition, calculate the 95% confidence interval of the average excess market return for each market. 2. What can we learn from these results? 5 6 Q1 7 8 59 50 51 52 Australia Canada France Germany Italy 1 1 1 0 0 0.0001 0.0005 0.0156 0.0517 0.0546 Japan Netherlands South Africa UK US 1 1 1 1 1 0.0024 0.0018 0.0021 0.0018 0.0001 h finance tables21 Draw Page Layout Formulas Data Review View Home Insert X Cut Copy - Paste Format Calibri (Body) 12 AA Wrap Text Number B 1 U- FOI Marge & Center % > H68 x fx A B D E F G 1 Q1 2 3 Mean 4 Std Dev 5 ci lower 6 ci upper 7 tstat 8 9 Mean 10 Std Dev 11 ci lower 12 ci upper 13 tstat Australia Canada France 0.0792 0.0654 0.0624 0.2169 0.1990 0.2775 0.0398 0.0292 0.0120 0.1186 0.1015 0.1128 3.9842 3.5826 2.4527 Japan Netherlands South Africa 0.0891 0.0717 0.0855 0.3133 0.2442 0.2958 0.0322 0.0273 0.0318 0.1459 0.1160 0.1392 3.1007 3.2003 3.1525 Germany 0.1422 0.7893 -0.0010 0.2855 1.9658 UK 0.067 0.2287 0.0255 0.1085 3.1969 Italy 0.0583 0.3273 -0.0012 0.1177 1.9417 US 0.0746 0.1983 0.0386 0.1106 4.1006 14 15 16 Problem Set Questions All questions about the relevant Matlab commands should be directed to Martin and Donald who will provide support in the Matlab commands. During the computing lab sessions you can work through the Matlab workbook and do the problem set questions and also receive feedback on your answers. It is important that you use this opportunity to receive informal feedback on your initial attempt at the problem set and how you can incorporate that feedback in improving your performance. The data for the problem set questions are in the project.xlsx file. This file contains the annual S returns of a number of equity markets around the world between 1901 and 2019. The file also contains the annual returns of U.S. Treasury Bills over the same period. The data is the Dimson, Nagel and Staunton historical returns database which is available through Momingstar Direct. Your group is required to select 10 different markets for your empirical analysis, which is your choice. You will also need the U.S. Treasury Bill returns to calculate the annual excess returns for each market in questions 1 and 3. As the data is in % terms, divide all the data by 100 to work in decimals. 1. For each of your markets, calculate the average excess returns, standard deviation, and the I-statistic of the null hypothesis that the average excess market return equals zero across the whole sample period. In addition, calculate the 95% confidence interval of the average excess market return for each market. 2. What can we learn from these results? 5 6 Q1 7 8 59 50 51 52 Australia Canada France Germany Italy 1 1 1 0 0 0.0001 0.0005 0.0156 0.0517 0.0546 Japan Netherlands South Africa UK US 1 1 1 1 1 0.0024 0.0018 0.0021 0.0018 0.0001 h finance tables21 Draw Page Layout Formulas Data Review View Home Insert X Cut Copy - Paste Format Calibri (Body) 12 AA Wrap Text Number B 1 U- FOI Marge & Center % > H68 x fx A B D E F G 1 Q1 2 3 Mean 4 Std Dev 5 ci lower 6 ci upper 7 tstat 8 9 Mean 10 Std Dev 11 ci lower 12 ci upper 13 tstat Australia Canada France 0.0792 0.0654 0.0624 0.2169 0.1990 0.2775 0.0398 0.0292 0.0120 0.1186 0.1015 0.1128 3.9842 3.5826 2.4527 Japan Netherlands South Africa 0.0891 0.0717 0.0855 0.3133 0.2442 0.2958 0.0322 0.0273 0.0318 0.1459 0.1160 0.1392 3.1007 3.2003 3.1525 Germany 0.1422 0.7893 -0.0010 0.2855 1.9658 UK 0.067 0.2287 0.0255 0.1085 3.1969 Italy 0.0583 0.3273 -0.0012 0.1177 1.9417 US 0.0746 0.1983 0.0386 0.1106 4.1006 14 15 16
Step by Step Solution
There are 3 Steps involved in it

Get step-by-step solutions from verified subject matter experts