

Question: I need the answers by using any electrical program and also the curve and the table below please. - Calculation: RLC band Pass filter with
I need the answers by using any electrical program and also the curve and the table below please.
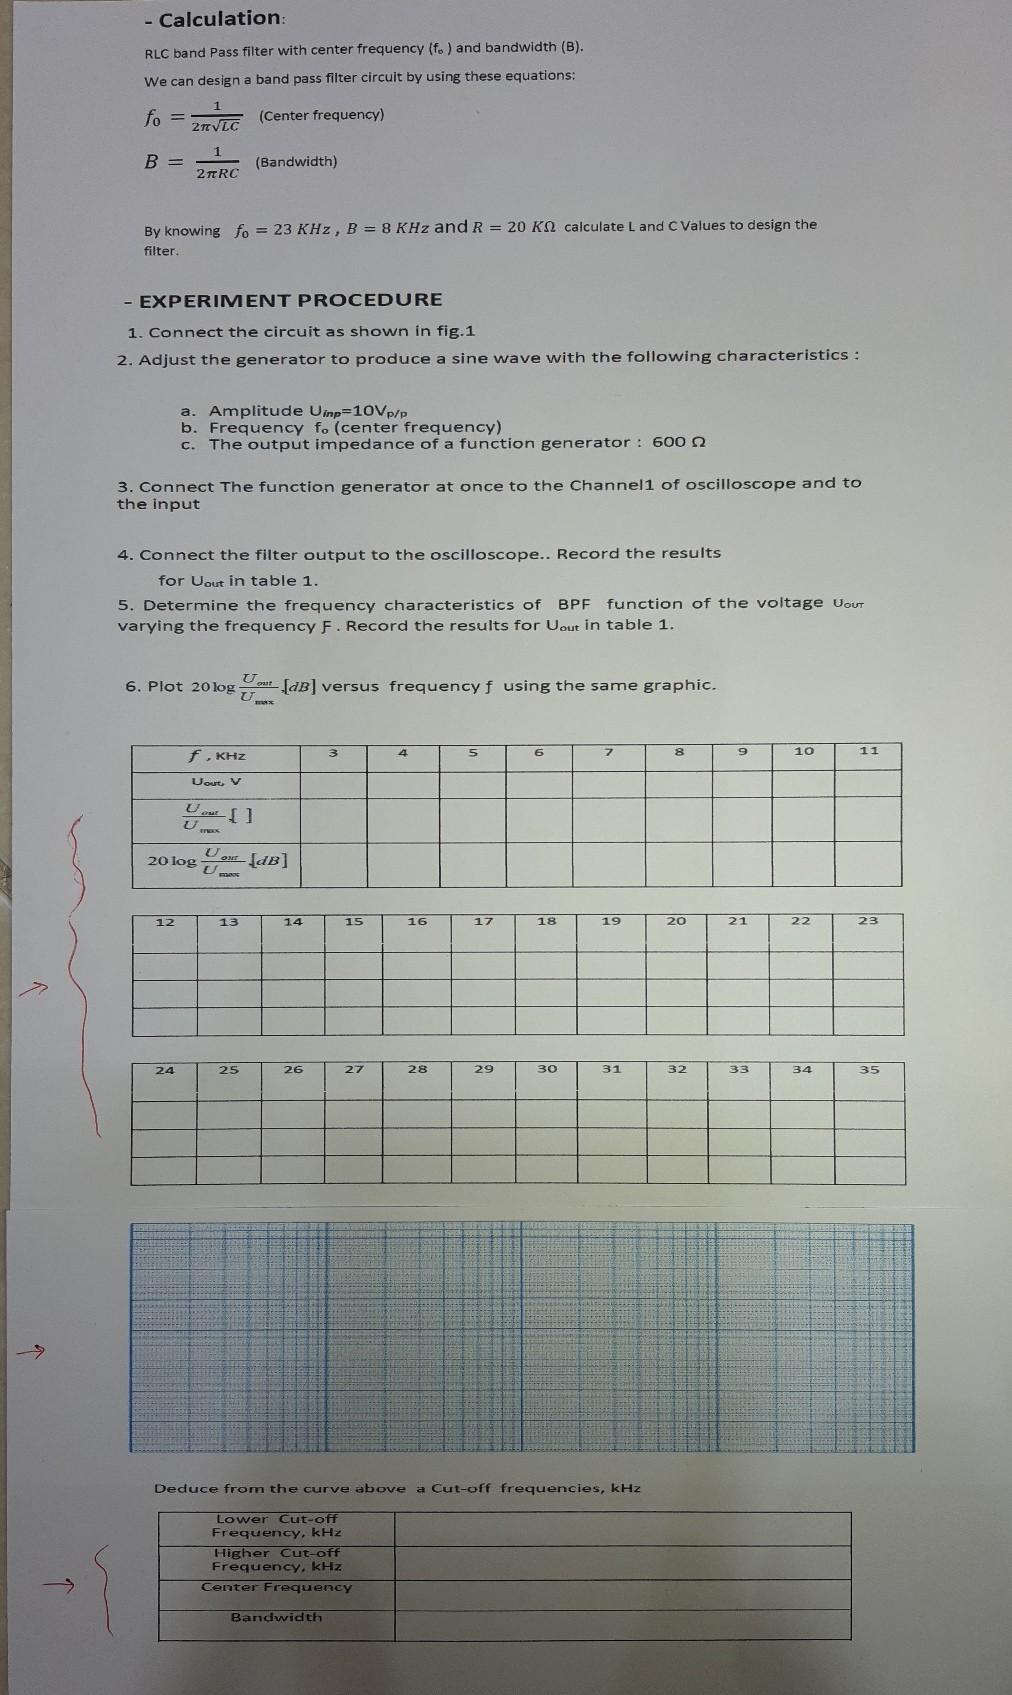
- Calculation: RLC band Pass filter with center frequency (f.) and bandwidth (B). We can design a band pass filter circuit by using these equations: fo (Center frequency) 20LC B = 1 2 RC (Bandwidth) By knowing fo = 23 KHz, B = 8 KHz and R = 20 KQ calculate L and C Values to design the filter. - EXPERIMENT PROCEDURE 1. Connect the circuit as shown in fig. 1 2. Adjust the generator to produce a sine wave with the following characteristics : a. Amplitude Vinp=10Vp/p b. Frequency fo (center frequency) c. The output impedance of a function generator : 600 22 3. Connect the function generator at once to the Channel1 of oscilloscope and to the input 4. Connect the filter output to the oscilloscope.. Record the results for Uout in table 1. 5. Determine the frequency characteristics of BPF function of the voltage Uout varying the frequency F. Record the results for Uout in table 1. 6. Plot 20 log [dB] versus frequency f using the same graphic. U. 4 5 6 7 8 9 10 11 f, KHZ Non v Ul U U (dB] 20 los Ums 12 13 14 15 16 1 17 18 19 20 21 22 23 24 25 26 27 28 29 30 31 32 33 34 35 Deduce from the curve above a Cut-off frequencies, kHz Lower Cut-off Frequency, kHz Higher Cut-off Frequency, kHz Center Frequency Bandwidth - Calculation: RLC band Pass filter with center frequency (f.) and bandwidth (B). We can design a band pass filter circuit by using these equations: fo (Center frequency) 20LC B = 1 2 RC (Bandwidth) By knowing fo = 23 KHz, B = 8 KHz and R = 20 KQ calculate L and C Values to design the filter. - EXPERIMENT PROCEDURE 1. Connect the circuit as shown in fig. 1 2. Adjust the generator to produce a sine wave with the following characteristics : a. Amplitude Vinp=10Vp/p b. Frequency fo (center frequency) c. The output impedance of a function generator : 600 22 3. Connect the function generator at once to the Channel1 of oscilloscope and to the input 4. Connect the filter output to the oscilloscope.. Record the results for Uout in table 1. 5. Determine the frequency characteristics of BPF function of the voltage Uout varying the frequency F. Record the results for Uout in table 1. 6. Plot 20 log [dB] versus frequency f using the same graphic. U. 4 5 6 7 8 9 10 11 f, KHZ Non v Ul U U (dB] 20 los Ums 12 13 14 15 16 1 17 18 19 20 21 22 23 24 25 26 27 28 29 30 31 32 33 34 35 Deduce from the curve above a Cut-off frequencies, kHz Lower Cut-off Frequency, kHz Higher Cut-off Frequency, kHz Center Frequency Bandwidth
Step by Step Solution
There are 3 Steps involved in it

Get step-by-step solutions from verified subject matter experts