

Question: I NEED THE CODE PLEASE!! d. [3 points] Modify the provided MATLAB code to compute the Fourier coefficients ak of y(t) for-50 S k s
![I NEED THE CODE PLEASE!! d. [3 points] Modify the provided](https://dsd5zvtm8ll6.cloudfront.net/si.experts.images/questions/2024/09/66f3a20911e46_76066f3a208742b5.jpg)
I NEED THE CODE PLEASE!!
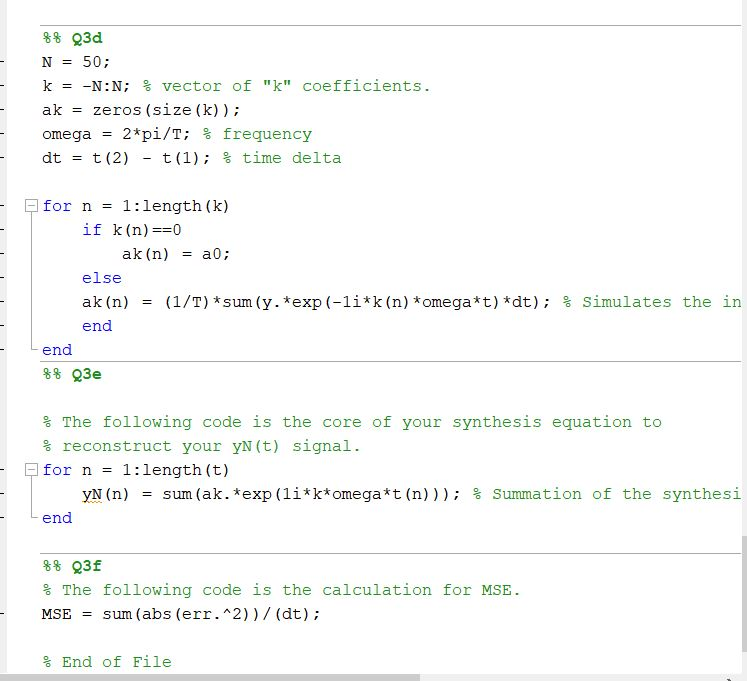
d. [3 points] Modify the provided MATLAB code to compute the Fourier coefficients ak of y(t) for-50 S k s 50. Plot the Fourier series coefficients ak, use the stem plot to plot both the real and imaginary components of the coefficients e. [11 points] Consider yx(t) to be the reconstructed signal from the Fourier coefficients, where-N and N are the limits of k. jhwot a.e Create code that will compute yro(t), yas(t), ys(t) ot), and y2 by implementing the synthesis equation for a finite number of k from-N to N. You will need to use/modify the code from part c to generate a's. Graph the reconstructed y(t) in each case. Include the plots in the report (use subplots) What happens when you increase N? Explain in detail f. [4 points] The approximation for error is given by: eut)y(t)-y(t) And the mean-squared error (MSE) is defined as MSEen (t)12 dt And the normalized MSE is defined as: MSE Modify the provided code so you can compute the MSE for the signals yro(t), ys(t) ys(t), y100(t), and yano (t). Plot the Normalized MSE vs number of coefficients. Include the plot in your report. What can be inferred about the convergence of the Fourier series? A good approximation can be described as a reconstruction having 5% error or lower. How many coefficients will be enough to get a good approximation of y(t)? d. [3 points] Modify the provided MATLAB code to compute the Fourier coefficients ak of y(t) for-50 S k s 50. Plot the Fourier series coefficients ak, use the stem plot to plot both the real and imaginary components of the coefficients e. [11 points] Consider yx(t) to be the reconstructed signal from the Fourier coefficients, where-N and N are the limits of k. jhwot a.e Create code that will compute yro(t), yas(t), ys(t) ot), and y2 by implementing the synthesis equation for a finite number of k from-N to N. You will need to use/modify the code from part c to generate a's. Graph the reconstructed y(t) in each case. Include the plots in the report (use subplots) What happens when you increase N? Explain in detail f. [4 points] The approximation for error is given by: eut)y(t)-y(t) And the mean-squared error (MSE) is defined as MSEen (t)12 dt And the normalized MSE is defined as: MSE Modify the provided code so you can compute the MSE for the signals yro(t), ys(t) ys(t), y100(t), and yano (t). Plot the Normalized MSE vs number of coefficients. Include the plot in your report. What can be inferred about the convergence of the Fourier series? A good approximation can be described as a reconstruction having 5% error or lower. How many coefficients will be enough to get a good approximation of y(t)
Step by Step Solution
There are 3 Steps involved in it

Get step-by-step solutions from verified subject matter experts