

Question: i need the current ratio, quick ratio, inventory turnover, average collection period, total asset turnover, dabt ratio, times interest earned, gross profit margin, operating profit
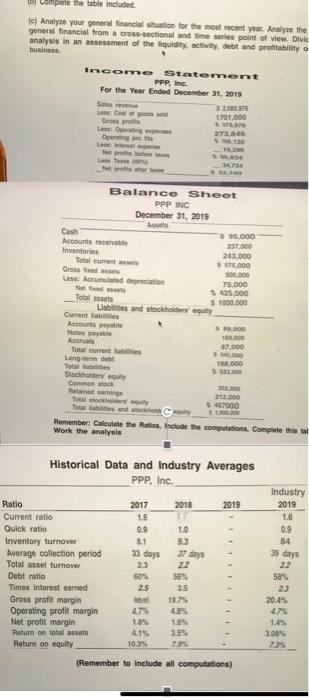
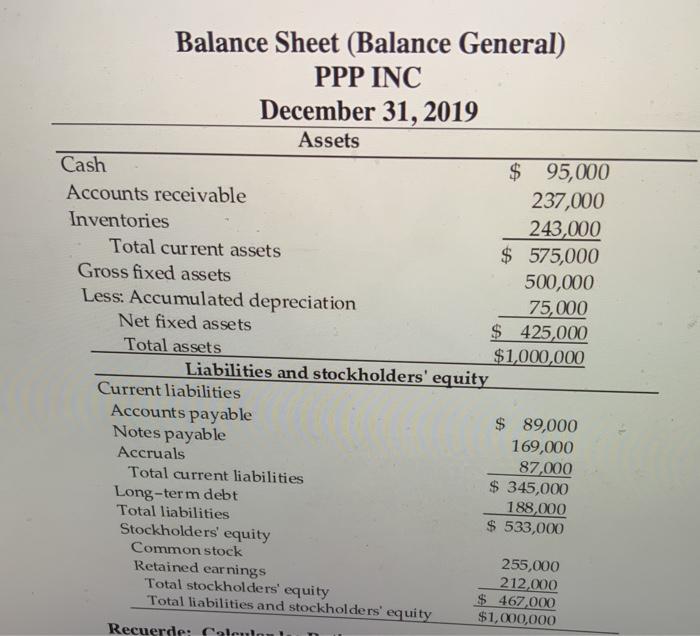
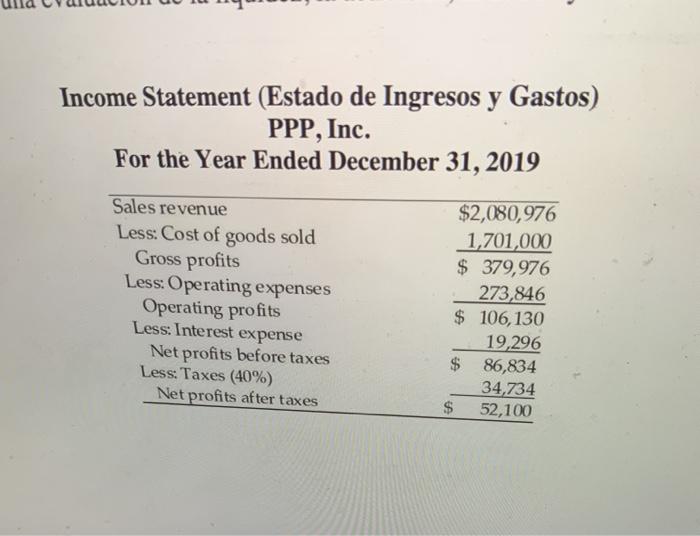
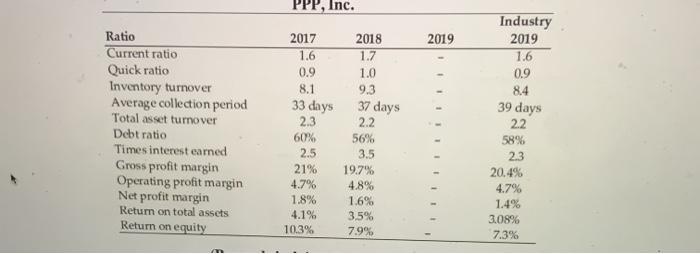
Complete the table included c) Analyze your general financial station for the most recent year. Anaya general financial trom a cross-sectional and time wis point of view. Divi analysis in an assessment of the liquidity activity debt and profitability business Income Statement PPP, Inc For the Year Ended December 31, 2019 3200 LC 1701.000 Gros 273,800 Balance Sheet PPP INC December 31, 2019 Cash S 95.000 Accounts rochable 237,000 Inventories 263.000 Total current 175.000 Gross 500.000 Accumulated 75.000 125.000 Total 5 1000000 Liabilities and stockholders Current Accountable 5.000 os Rorais 07.000 Tot current 000 Long-term debet 185.000 Tubes 5 53 Sto Commons 2000 endamine 213.000 7000 Remember Calculate the Ratios, include the computations Complete Work the analysis 2017 Historical Data and Industry Averages PPP, Inc. Ratio 2018 2019 Current ratio 1.5 Quick ratio 0.9 10 Inventory turnover 81 Average collection period 33 days Total asset turnover 23 Debt ratio Times Interest earned 25 35 Gross profit margin 1973 Operating profit margin 4.75 405 Net profit margin 18 16 Return on total assets 3.5% Return on equity 1073 7.95 Industry 2019 1.B 0.9 84 39 days 22 58% 23 20.4% 47 1.45 2009 (Remember to include all computations) Balance Sheet (Balance General) PPP INC December 31, 2019 Assets Cash $ 95,000 Accounts receivable 237,000 Inventories 243,000 Total current assets $ 575,000 Gross fixed assets 500,000 Less: Accumulated depreciation 75,000 Net fixed assets $ 425,000 Total assets $1,000,000 Liabilities and stockholders' equity Current liabilities Accounts payable $ 89,000 Notes payable 169,000 Accruals 87,000 Total current liabilities $ 345,000 Long-term debt 188,000 Total liabilities $ 533,000 Stockholders' equity Common stock 255,000 Retained earnings 212,000 Total stockholders' equity $ 467 000 Total liabilities and stockholders' equity $1,000,000 Recuerde: Calcul Income Statement (Estado de Ingresos y Gastos) PPP, Inc. For the Year Ended December 31, 2019 Sales revenue Less: Cost of goods sold Gross profits Less: Operating expenses Operating profits Less: Interest expense Net profits before taxes Less: Taxes (40%) Net profits after taxes $2,080,976 1,701,000 $ 379,976 273,846 $ 106,130 19,296 $ 86,834 34,734 $ 52,100 PPP, Inc. 2019 Industry 2019 1.6 0.9 8.4 39 days 22 Ratio Current ratio Quick ratio Inventory turnover Average collection period Total asset turnover Debt ratio Times interest earned Gross profit margin Operating profit margin Net profit margin Return on total assets Return on equity 2017 1.6 0.9 8.1 33 days 2.3 60% 2.5 21% 4.7% 1.8% 4.1% 10.3% 2018 1.7 1.0 9.3 37 days 2.2 56% 3.5 19.7% 4.8% 1.6% 3.5% 7.9% 58% 23 20.4% 4.7% 1.4% 3.08% 7.3%
Step by Step Solution
There are 3 Steps involved in it

Get step-by-step solutions from verified subject matter experts