

Question: I need the know how to do the graph. Problem 1. A small firm builds galvanized swing sets. The investment in plant and equipment is
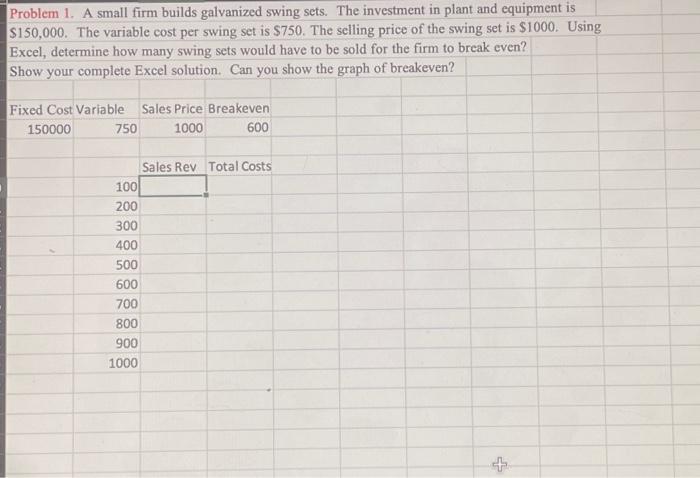
Problem 1. A small firm builds galvanized swing sets. The investment in plant and equipment is $150,000. The variable cost per swing set is $750. The selling price of the swing set is $1000. Using Excel, determine how many swing sets would have to be sold for the firm to break even? Show your complete Excel solution. Can you show the graph of breakeven? \begin{tabular}{|r|r|r|} \hline Fixed Cost Variable & Sales Price Breakeven \\ \hline 150000 & 750 & 1000 \\ \hline & & \\ \hline & Sales Rev Total Costs \\ \hline 200 & \\ \hline 300 \\ \hline 400 \\ \hline 500 \\ \hline 600 \\ \hline 700 \\ \hline 800 \\ \hline 900 \\ \hline 1000 \\ \hline \end{tabular}
Step by Step Solution
There are 3 Steps involved in it

Get step-by-step solutions from verified subject matter experts