

Question: i need the roa's for problem 6 adjusted because the annual growth rate numbers changed in #3 MyQiung Cho, Ph.D. FA Group Project Firm-specific requirements
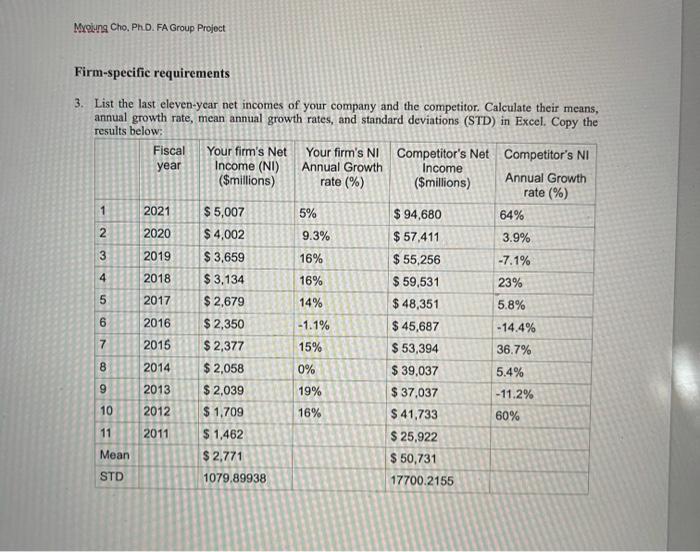
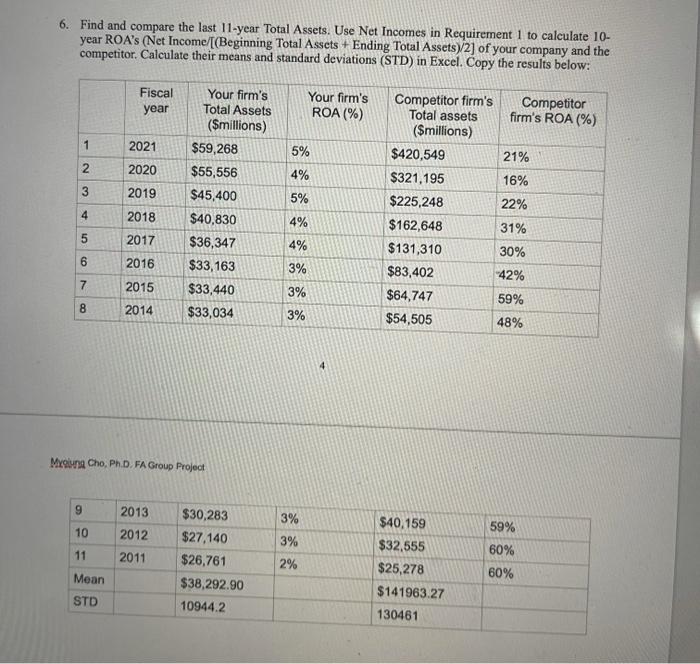
MyQiung Cho, Ph.D. FA Group Project Firm-specific requirements 3. List the last eleven-year net incomes of your company and the competitor. Calculate their means, annual growth rate, mean annual growth rates, and standard deviations (STD) in Excel. Copy the results below: Fiscal Your firm's Net Your firm's NI Competitor's Net Competitor's NI year Income (NI) Annual Growth Income ($millions) rate (%) Annual Growth ($millions) rate (%) 1 2021 $ 5,007 5% $ 94,680 64% 2 2020 $ 4,002 9.3% $ 57,411 3.9% 3 2019 $ 3,659 16% $ 55,256 -7.1% 4 2018 $3,134 16% $ 59,531 23% 2017 $ 2,679 14% $ 48,351 5.8% 6 2016 $ 2,350 -1.1% $ 45,687 -14.4% 7 2016 $ 2,377 15% $ 53,394 36.7% 8 2014 $ 2,058 0% $ 39,037 5.4% 9 2013 $ 2,039 19% $ 37,037 -11.2% 10 2012 $ 1,709 16% $ 41,733 60% 11 2011 $ 1,462 $ 25,922 Mean $ 2,771 $ 50,731 STD 1079.89938 17700.2155 5 OD 6. Find and compare the last 11-year Total Assets. Use Net Incomes in Requirement 1 to calculate 10- year ROA's (Net Income/[(Beginning Total Assets + Ending Total Assets)/2] of your company and the competitor. Calculate their means and standard deviations (STD) in Excel. Copy the results below: Fiscal year Your firm's ROA (%) 1 2021 2 2020 5% 4% 5% 3 Your firm's Total Assets (Smillions) $59,268 $55,556 $45,400 $40,830 $36,347 $33,163 $33,440 $33,034 2019 4 2018 Competitor firm's Competitor Total assets firm's ROA (%) ($millions) $420,549 21% $321,195 16% $225,248 22% $162,648 31% $131,310 30% $83,402 42% $64,747 59% $54,505 48% 4% 6 5 2017 4% 6 2016 7 2015 3% 3% 3% 8 CD 2014 4 Myoung Cho, Ph.D. FA Group Project 9 3% 59% 10 2013 2012 2011 11 $30,283 $27,140 $26,761 $38,292.90 10944.2 3% 2% 60% $40,159 $32,555 $25,278 $141963.27 130461 Mean 60% STD MyQiung Cho, Ph.D. FA Group Project Firm-specific requirements 3. List the last eleven-year net incomes of your company and the competitor. Calculate their means, annual growth rate, mean annual growth rates, and standard deviations (STD) in Excel. Copy the results below: Fiscal Your firm's Net Your firm's NI Competitor's Net Competitor's NI year Income (NI) Annual Growth Income ($millions) rate (%) Annual Growth ($millions) rate (%) 1 2021 $ 5,007 5% $ 94,680 64% 2 2020 $ 4,002 9.3% $ 57,411 3.9% 3 2019 $ 3,659 16% $ 55,256 -7.1% 4 2018 $3,134 16% $ 59,531 23% 2017 $ 2,679 14% $ 48,351 5.8% 6 2016 $ 2,350 -1.1% $ 45,687 -14.4% 7 2016 $ 2,377 15% $ 53,394 36.7% 8 2014 $ 2,058 0% $ 39,037 5.4% 9 2013 $ 2,039 19% $ 37,037 -11.2% 10 2012 $ 1,709 16% $ 41,733 60% 11 2011 $ 1,462 $ 25,922 Mean $ 2,771 $ 50,731 STD 1079.89938 17700.2155 5 OD 6. Find and compare the last 11-year Total Assets. Use Net Incomes in Requirement 1 to calculate 10- year ROA's (Net Income/[(Beginning Total Assets + Ending Total Assets)/2] of your company and the competitor. Calculate their means and standard deviations (STD) in Excel. Copy the results below: Fiscal year Your firm's ROA (%) 1 2021 2 2020 5% 4% 5% 3 Your firm's Total Assets (Smillions) $59,268 $55,556 $45,400 $40,830 $36,347 $33,163 $33,440 $33,034 2019 4 2018 Competitor firm's Competitor Total assets firm's ROA (%) ($millions) $420,549 21% $321,195 16% $225,248 22% $162,648 31% $131,310 30% $83,402 42% $64,747 59% $54,505 48% 4% 6 5 2017 4% 6 2016 7 2015 3% 3% 3% 8 CD 2014 4 Myoung Cho, Ph.D. FA Group Project 9 3% 59% 10 2013 2012 2011 11 $30,283 $27,140 $26,761 $38,292.90 10944.2 3% 2% 60% $40,159 $32,555 $25,278 $141963.27 130461 Mean 60% STD
Step by Step Solution
There are 3 Steps involved in it

Get step-by-step solutions from verified subject matter experts