

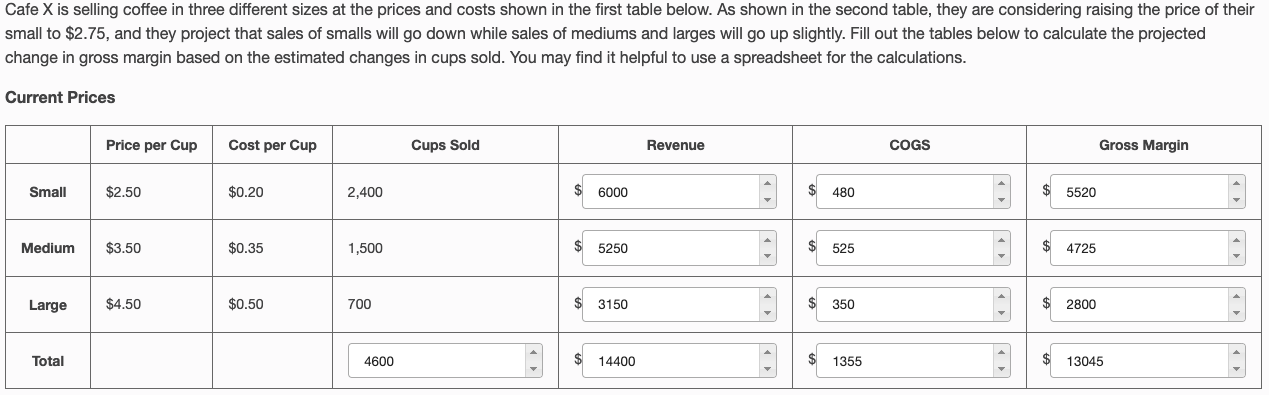
Question: I need the second chart, thank you! Cafe X is selling coffee in three different sizes at the prices and costs shown in the first
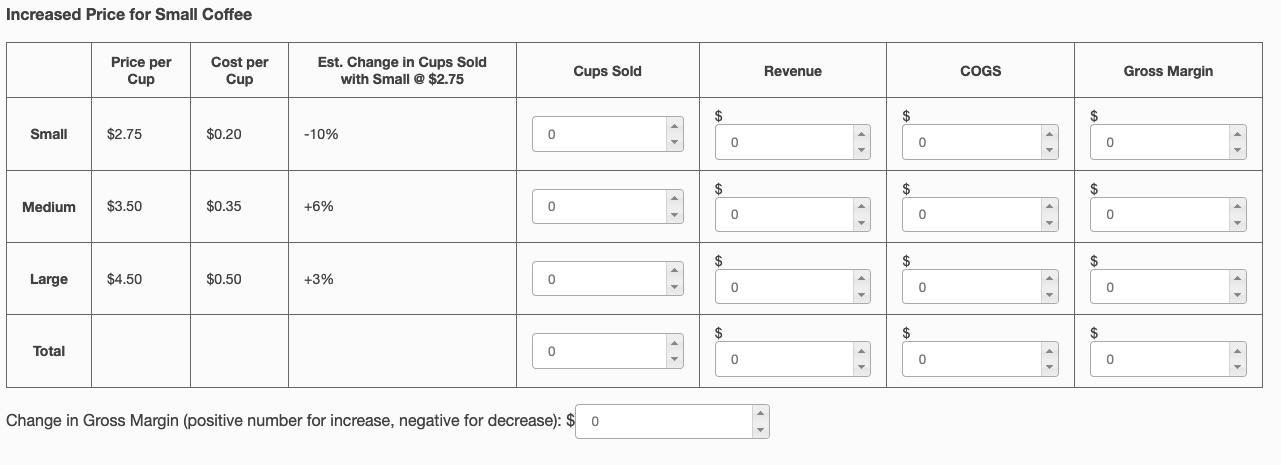 I need the second chart, thank you!
Step by Step Solution
There are 3 Steps involved in it
1 Expert Approved Answer
Step: 1 Unlock

Question Has Been Solved by an Expert!
Get step-by-step solutions from verified subject matter experts
Step: 2 Unlock
Step: 3 Unlock