

Question: The Ministry publishes the national energy balance annually showing the primary energy supply and the final energy consumption. Your supervisor complains that it is usually
- The Ministry publishes the national energy balance annually showing the primary energy supply and the final energy consumption. Your supervisor complains that it is usually difficult to explain the energy balance to politicians and decision makers. You suggest that it is possible to visualize the data in the form of a Sankey diagram. Your supervisor asked you to show the changes in energy utilization in Jordan (primary, conversion, final) between 2008 and 2018 through Sankey diagrams based on the data compiled by the Ministry. The data can be accessed at: https://www.memr.gov.jo/echobusv3.0/SystemAssets/7d656e6a-3b81-4382-96cbaff17297c7fb.pdf.
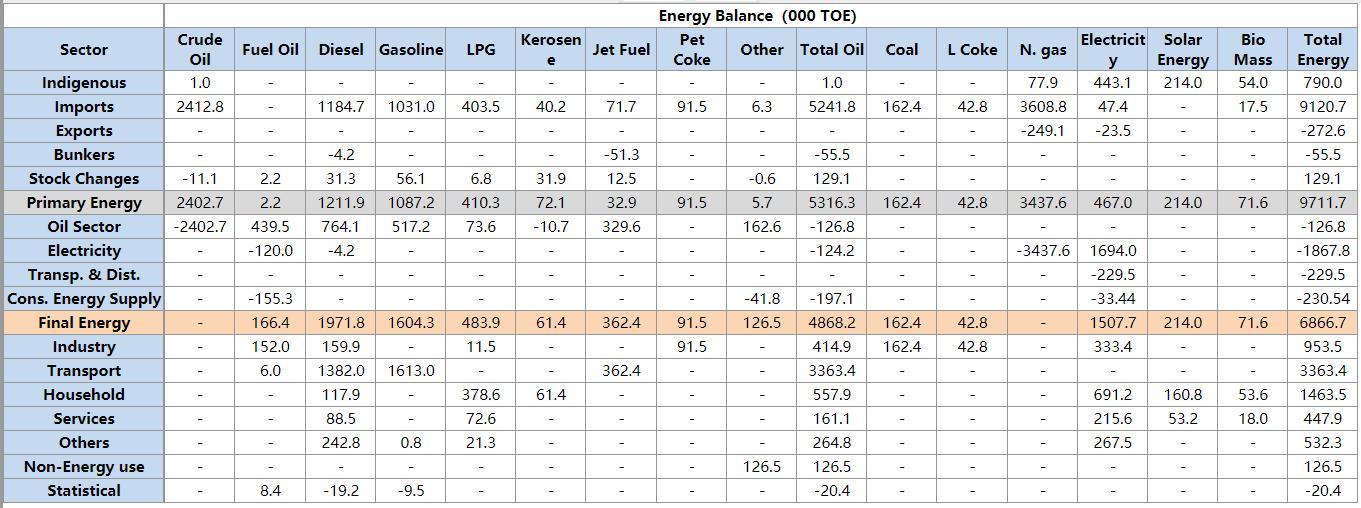
Energy Balance (000 TOE) Crude Kerosen Pet Electricit Solar Bio Total Sector Fuel Oil Diesel Gasoline LPG Jet Fuel Other Total Oil Coal L Coke N. gas Oil Coke Energy Mass Energy e y Indigenous 1.0 1.0 77.9 443.1 214.0 54.0 790.0 - Imports 2412.8 1184.7 1031.0 403.5 40.2 71.7 91.5 6.3 5241.8 162.4 42.8 3608.8 47.4 17.5 9120.7 Exports -249.1 -23.5 -272.6 - - - Bunkers -4.2 -51.3 -55.5 - -55.5 - Stock Changes -11.1 2.2 31.3 56.1 6.8 31.9 12.5 -0.6 129.1 129.1 Primary Energy 2402.7 2.2 1211.9 1087.2 410.3 72.1 32.9 91.5 5.7 5316.3 162.4 42.8 3437.6 467.0 214.0 71.6 9711.7 Oil Sector -2402.7 439.5 764.1 517.2 73.6 -10.7 329.6 162.6 -126.8 -126.8 - Electricity -120.0 -4.2 -124.2 -3437.6 1694.0 -1867.8 - Transp. & Dist. Cons. Energy Supply -229.5 -229.5 - -155.3 -41.8 -197.1 -33.44 -230.54 Final Energy 166.4 1971.8 1604.3 483.9 61.4 362.4 91.5 126.5 4868.2 162.4 42.8 1507.7 214.0 71.6 6866.7 Industry 152.0 159.9 11.5 91.5 414.9 162.4 42.8 333.4 953.5 - Transport 6.0 1382.0 1613.0 362.4 3363.4 3363.4 - Household 117.9 378.6 61.4 557.9 691.2 160.8 53.6 1463.5 Services 88.5 72.6 161.1 215.6 53.2 18.0 447.9 Others 242.8 0.8 21.3 264.8 267.5 532.3 Non-Energy use 126.5 126.5 126.5 Statistical 8.4 -19.2 -9.5 -20.4 -20.4
Step by Step Solution
3.48 Rating (158 Votes )
There are 3 Steps involved in it
To visualize the changes in energy utilization in Jordan from 2008 to 2018 through a Sankey diagram follow these steps Step 1 Understand the Energy Ba... View full answer

Get step-by-step solutions from verified subject matter experts