

Question: I need the solution of the following Statistical Data Analysis question. Thanks. 1. 5 points each. The Federal Bureau of Investigation (FBI), as part of
I need the solution of the following Statistical Data Analysis question. Thanks.
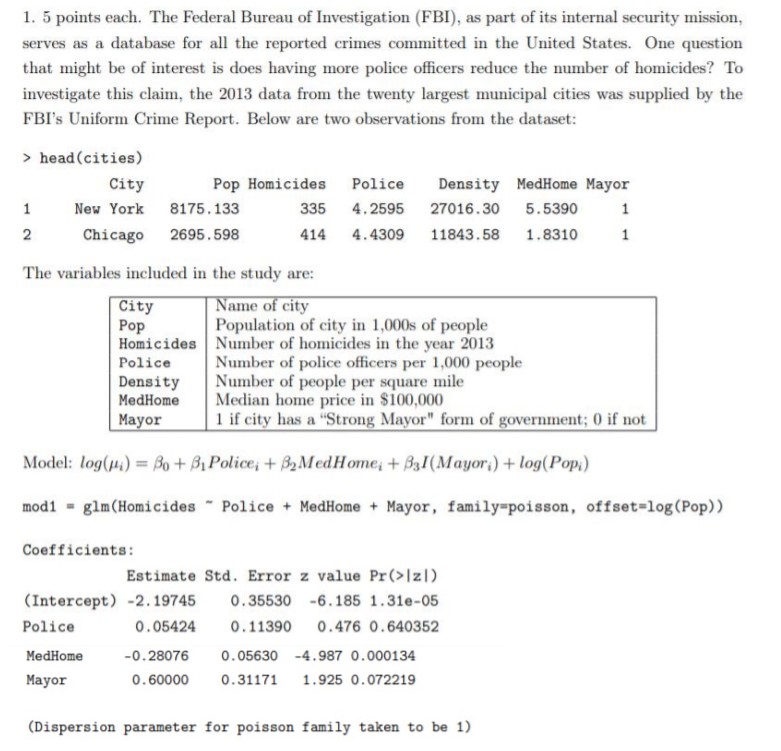
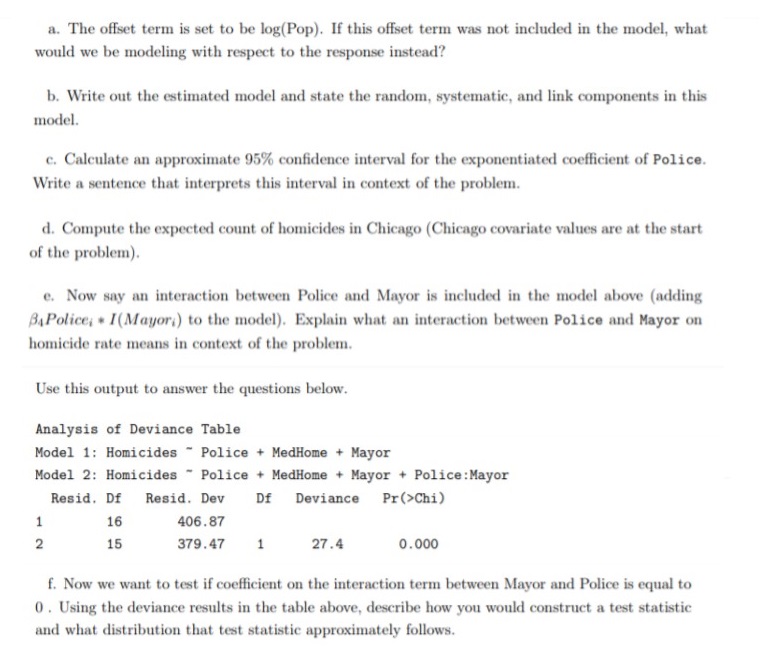
1. 5 points each. The Federal Bureau of Investigation (FBI), as part of its internal security mission, serves as a database for all the reported crimes committed in the United States. One question that might be of interest is does having more police officers reduce the number of homicides? To investigate this claim, the 2013 data from the twenty largest municipal cities was supplied by the FBI's Uniform Crime Report. Below are two observations from the dataset: > head (cities) City Pop Homicides Police Density MedHome Mayor New York 8175. 133 335 4. 2595 27016.30 5.5390 N Chicago 2695. 598 414 4.4309 11843.58 1.8310 The variables included in the study are: City Name of city Pop Population of city in 1,000s of people Homicides Number of homicides in the year 2013 Police Number of police officers per 1,000 people Density Number of people per square mile MedHome Median home price in $100,000 Mayor 1 if city has a "Strong Mayor" form of government; 0 if not Model: log(/4) = Bo + By Police, + 82 MedHome, + ByI(Mayor,) + log(Pop;) mod1 = glm(Homicides " Police + MedHome + Mayor, family=poisson, offset=log(Pop)) Coefficients: Estimate Std. Error z value Pr(>|zl) (Intercept) -2. 19745 0. 35530 -6. 185 1.31e-05 Police 0. 05424 0. 11390 0.476 0.640352 MedHome -0.28076 0. 05630 -4.987 0. 000134 Mayor 0. 60000 0. 31171 1.925 0. 072219 (Dispersion parameter for poisson family taken to be 1)a. The offset term is set to be log(Pop). If this offset term was not included in the model, what would we be modeling with respect to the response instead? b. Write out the estimated model and state the random, systematic, and link components in this model. c. Calculate an approximate 95% confidence interval for the exponentialed coefficient of Police. Write a sentence that interprets this interval in context of the problem. d. Compute the expected count of homicides in Chicago (Chicago covariate values are at the start of the problem). e. Now say an interaction between Police and Mayor is included in the model above (adding BAPolice, * I(Mayor,) to the model). Explain what an interaction between Police and Mayor on homicide rate means in context of the problem. Use this output to answer the questions below. Analysis of Deviance Table Model 1: Homicides " Police + MedHome + Mayor Model 2: Homicides " Police + MedHome + Mayor + Police:Mayor Resid. Df Resid Dev Df Deviance Pr(>Chi) 16 406.87 2 15 379.47 1 27.4 0.000 f. Now we want to test if coefficient on the interaction term between Mayor and Police is equal to 0 . Using the deviance results in the table above, describe how you would construct a test statistic and what distribution that test statistic approximately follows
Step by Step Solution
There are 3 Steps involved in it

Get step-by-step solutions from verified subject matter experts