

Question: i need the vertical and horizontal analysis . A. Horizontal Analysis a. Compute the difference in each line item from 2018 to 2019. b. Using
 i need the vertical and horizontal analysis .
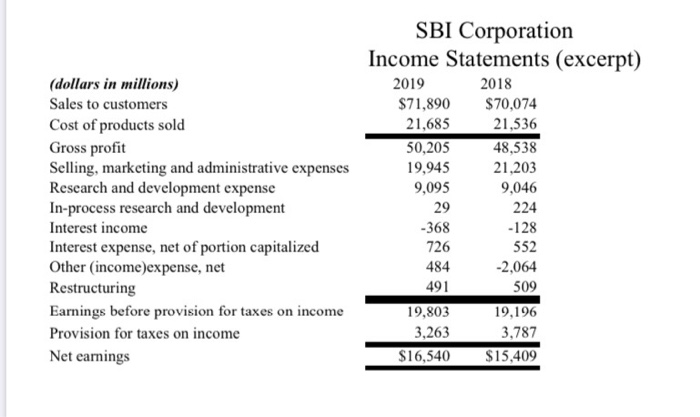
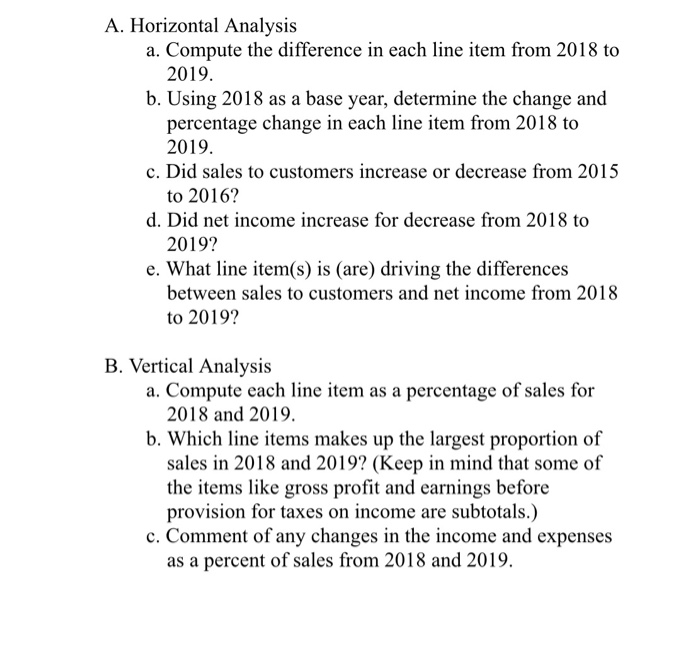
 SBI Corporation Income Statements (excerpt) (dollars in millions) 2019 2018 $71,890 $70,074 Sales to customers 21,685 21,536 48,538 Cost of products sold 50,205 Gross profit Selling, marketing and administrative expenses Rescarch and development expense In-process research and development 19,945 21,203 9,095 9,046 224 29 -128 Interest income -368 Interest expense, net of portion capitalized Other (income)expense, net Restructuring 726 552 484 -2,064 491 509 19,803 3,263 $16,540 19,196 Earnings before provision for taxes on income Provision for taxes on income 3.787 $15,409 Net earnings A. Horizontal Analysis a. Compute the difference in each line item from 2018 to 2019. b. Using 2018 as a base year, determine the change and percentage change in each line item from 2018 to 2019. c. Did sales to customers increase or decrease from 2015 to 2016? d. Did net income increase for decrease from 2018 to 2019? e. What line item(s) is (are) driving the differences between sales to customers and net income from 2018 to 2019? B. Vertical Analysis a. Compute each line item as a percentage of sales for 2018 and 2019. b. Which line items makes up the largest proportion of sales in 2018 and 2019? (Keep in mind that some of the items like gross profit and earnings before provision for taxes on income are subtotals.) c. Comment of any changes in the income and expenses as a percent of sales from 2018 and 2019
Step by Step Solution
There are 3 Steps involved in it

Get step-by-step solutions from verified subject matter experts