

Question: I need these two sets of data put into a graph in R studio showing a potential coorelation. I also need to see the scripts
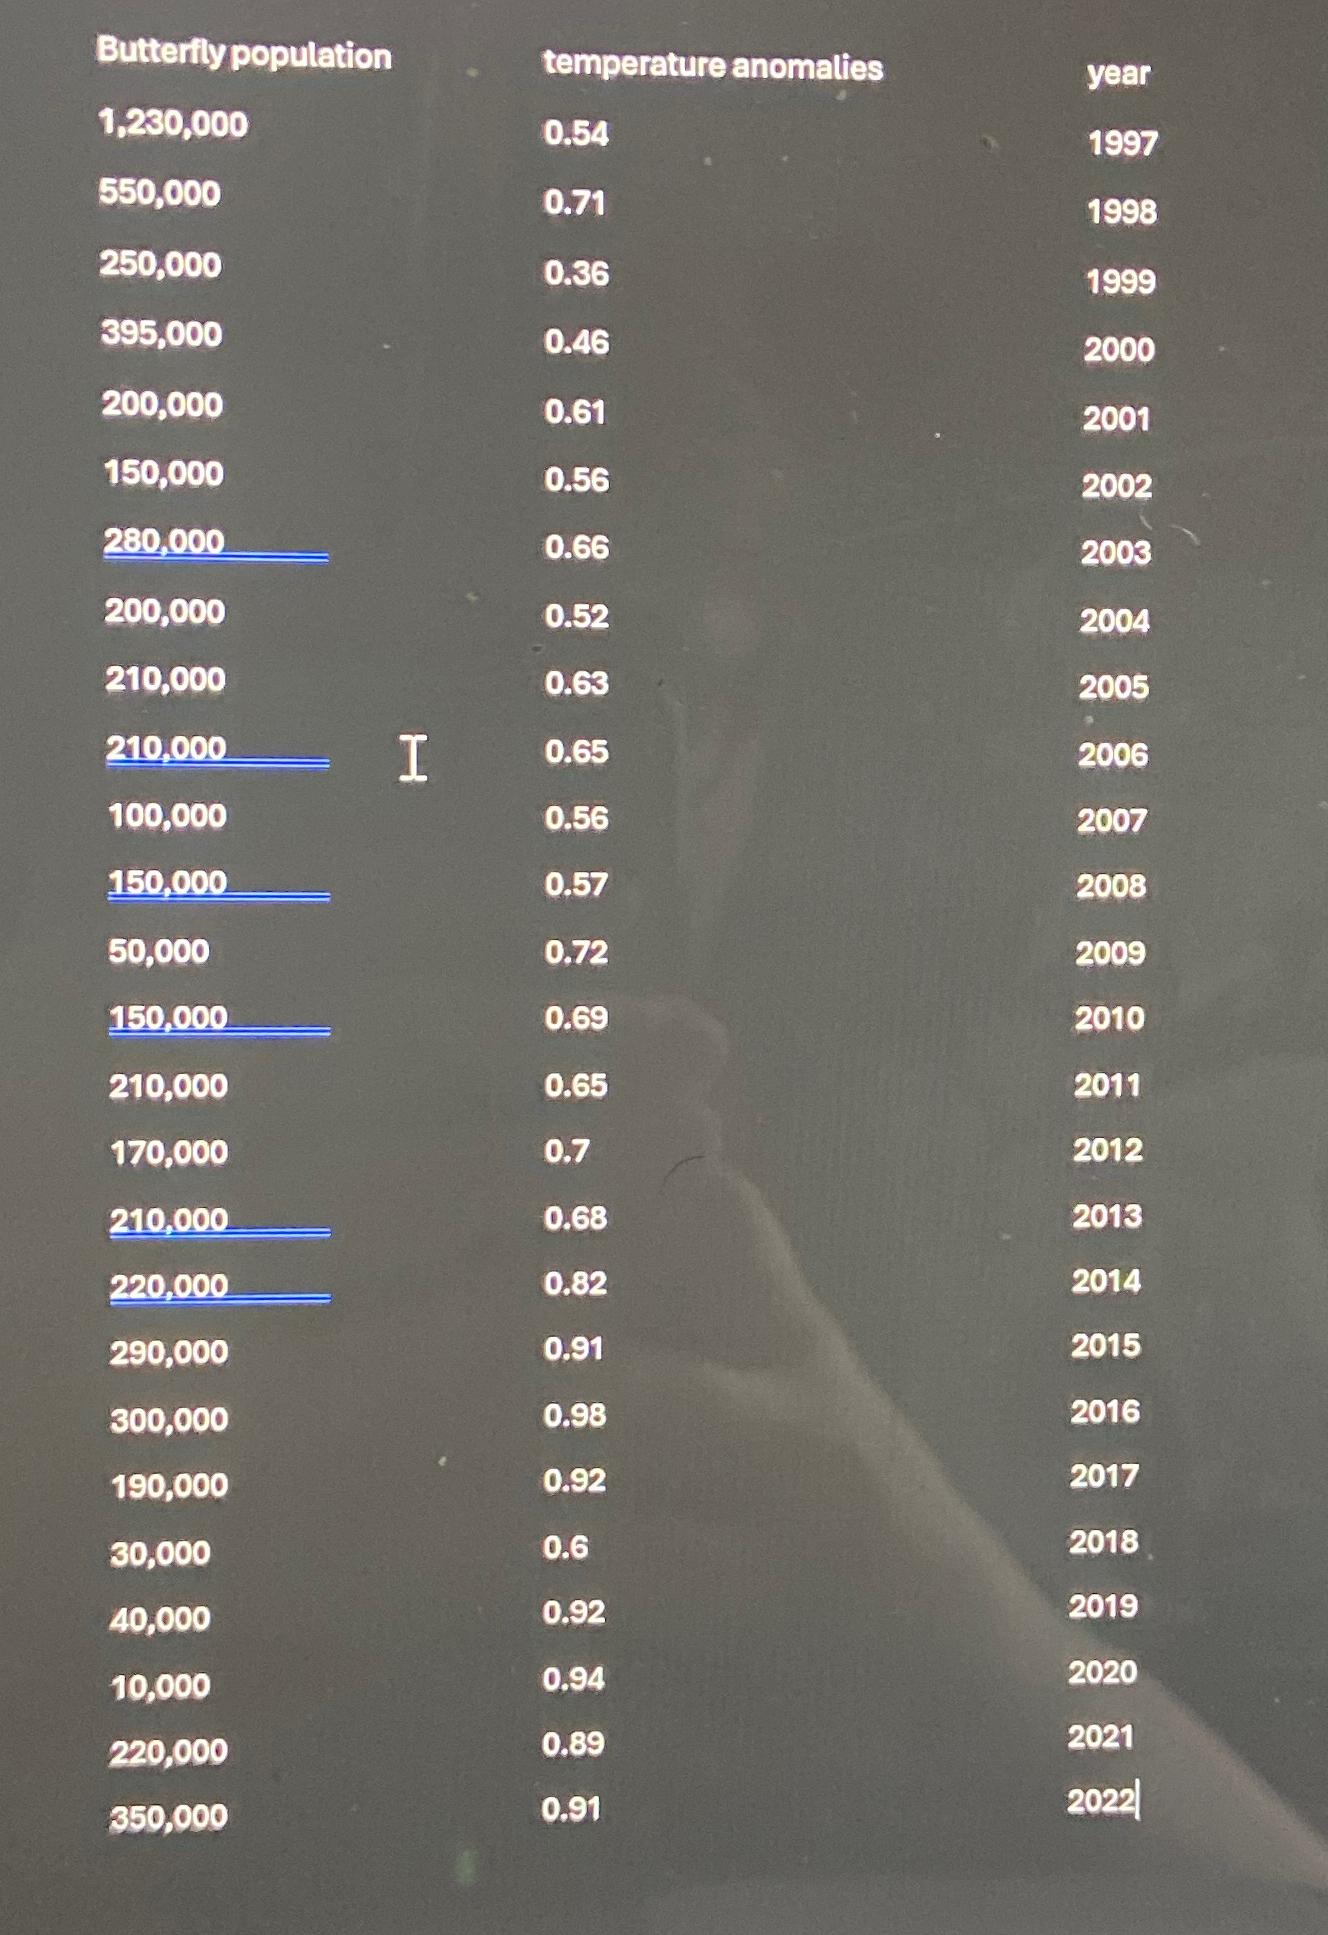
I need these two sets of data put into a graph in R studio showing a potential coorelation. I also need to see the scripts so I can see how it was done. DATA butterfly population and temperature anomalies through to
Step by Step Solution
There are 3 Steps involved in it
1 Expert Approved Answer
Step: 1 Unlock

Question Has Been Solved by an Expert!
Get step-by-step solutions from verified subject matter experts
Step: 2 Unlock
Step: 3 Unlock