

Question: I NEED THIS ASAP. THANKS PLEASE EXPLAIN AND INTERPRET Problem 1 A study has shown that males in the UK have steadily grown in height
I NEED THIS ASAP. THANKS
PLEASE EXPLAIN AND INTERPRET
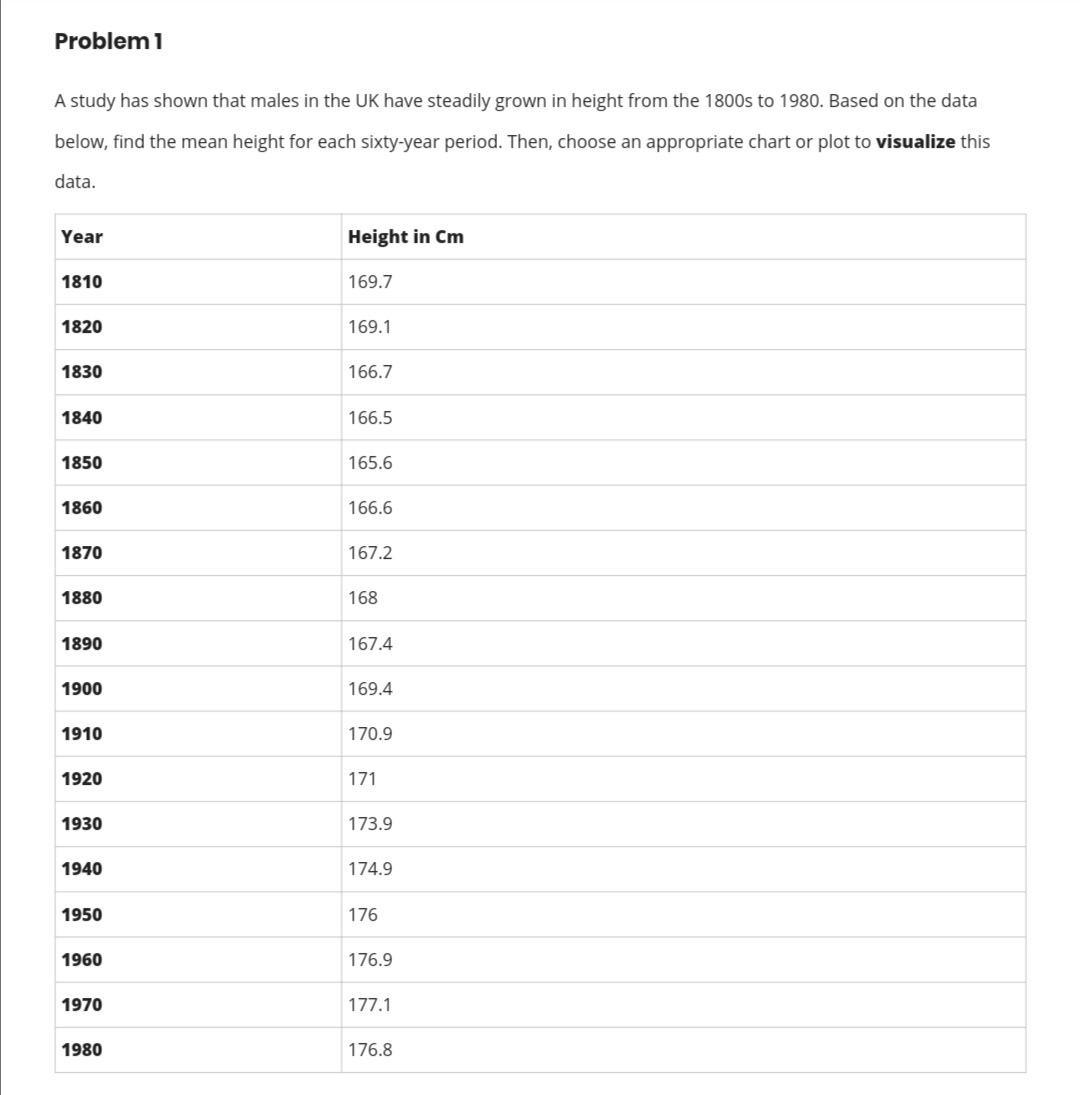
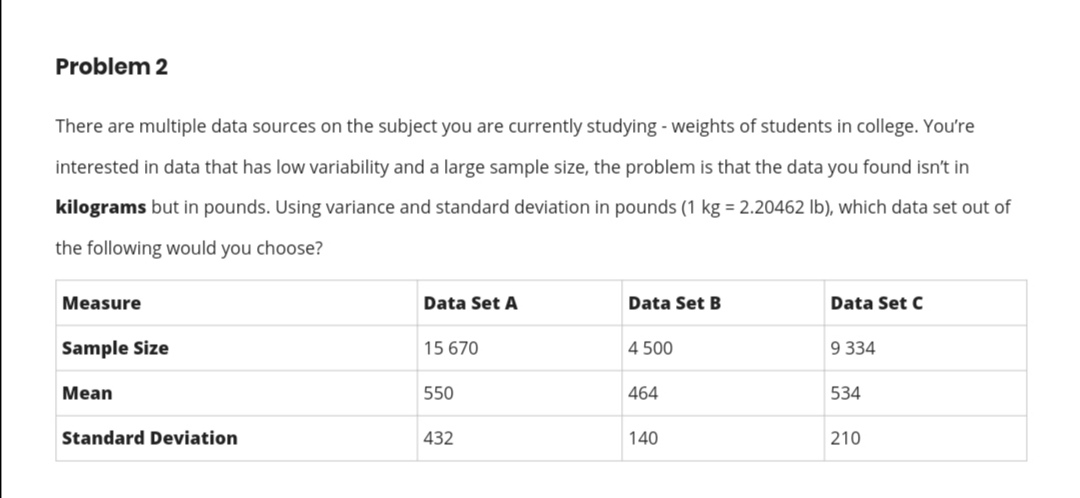
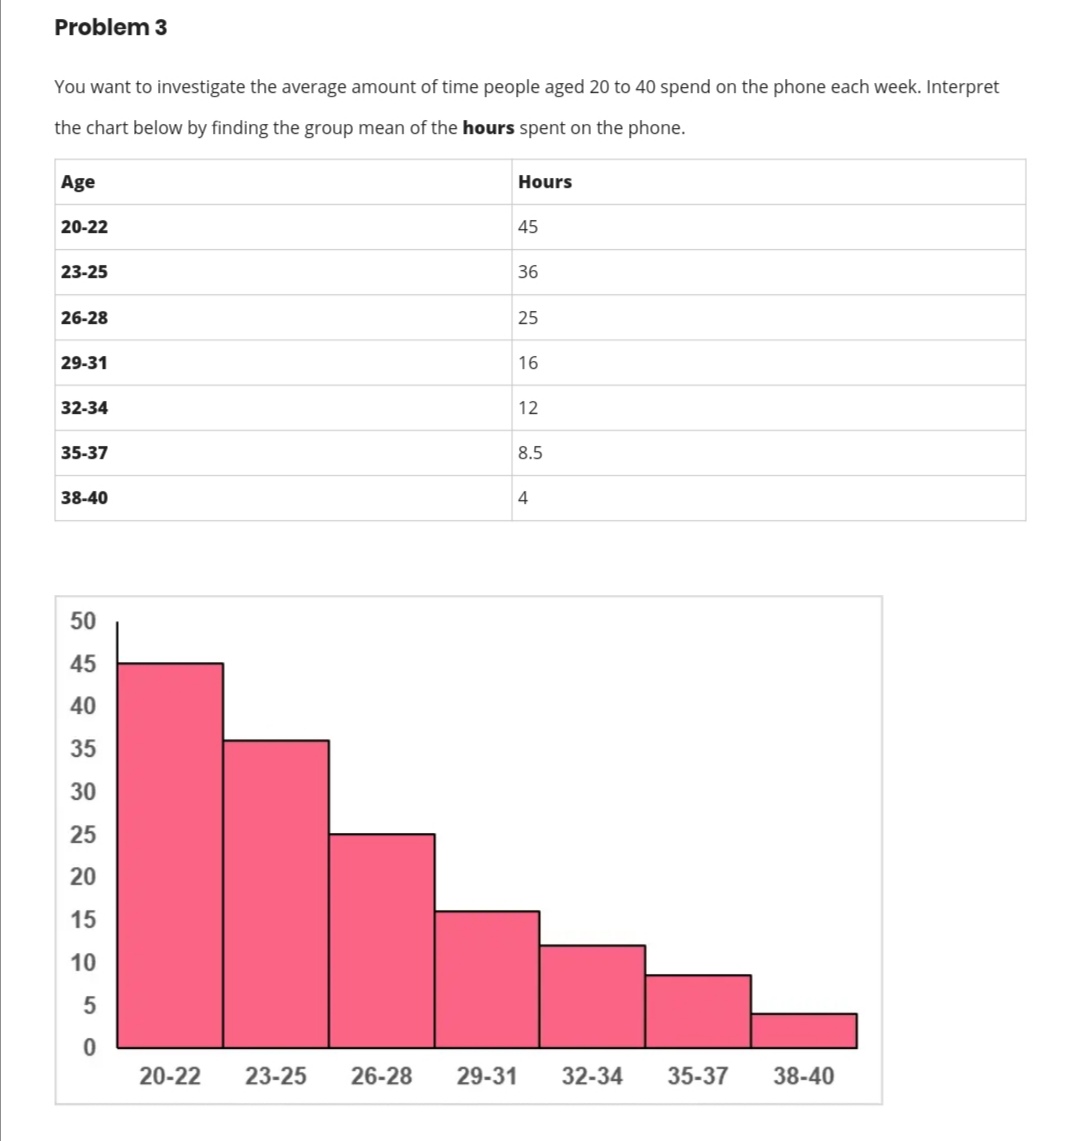
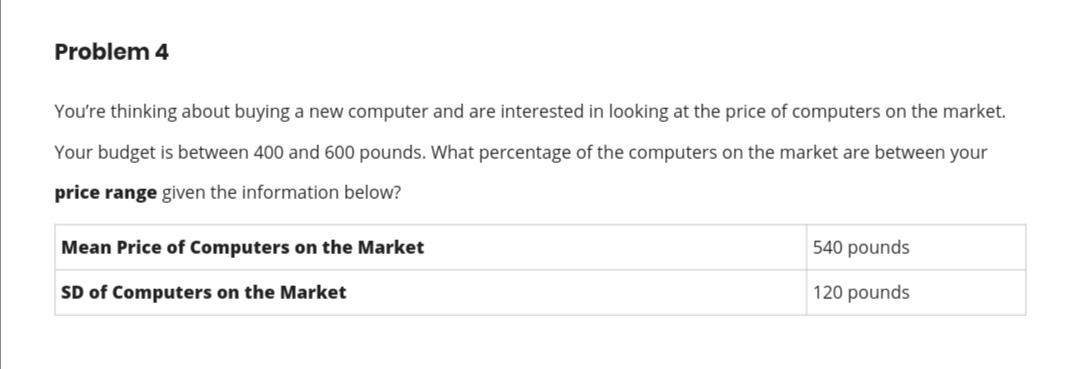
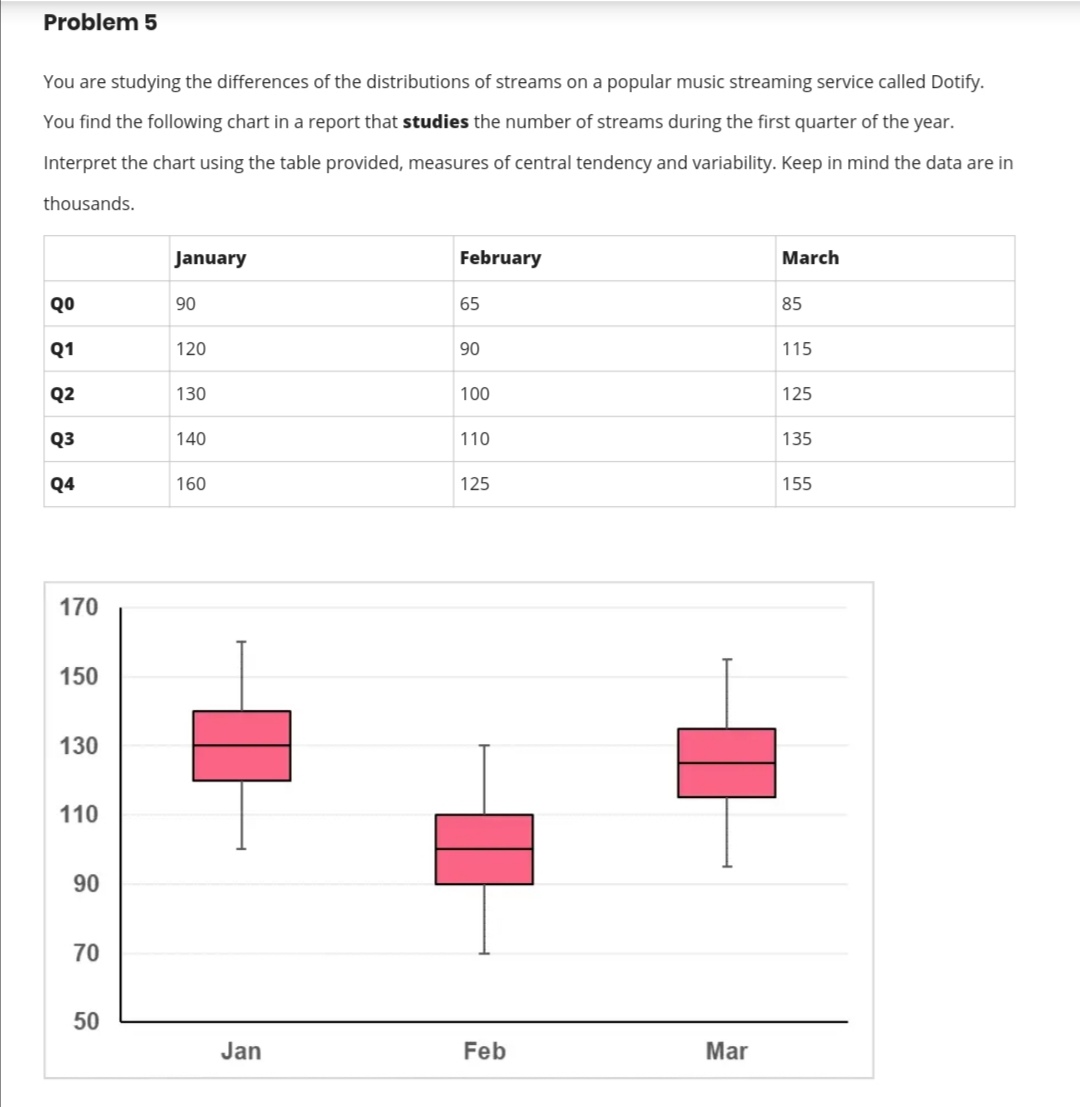
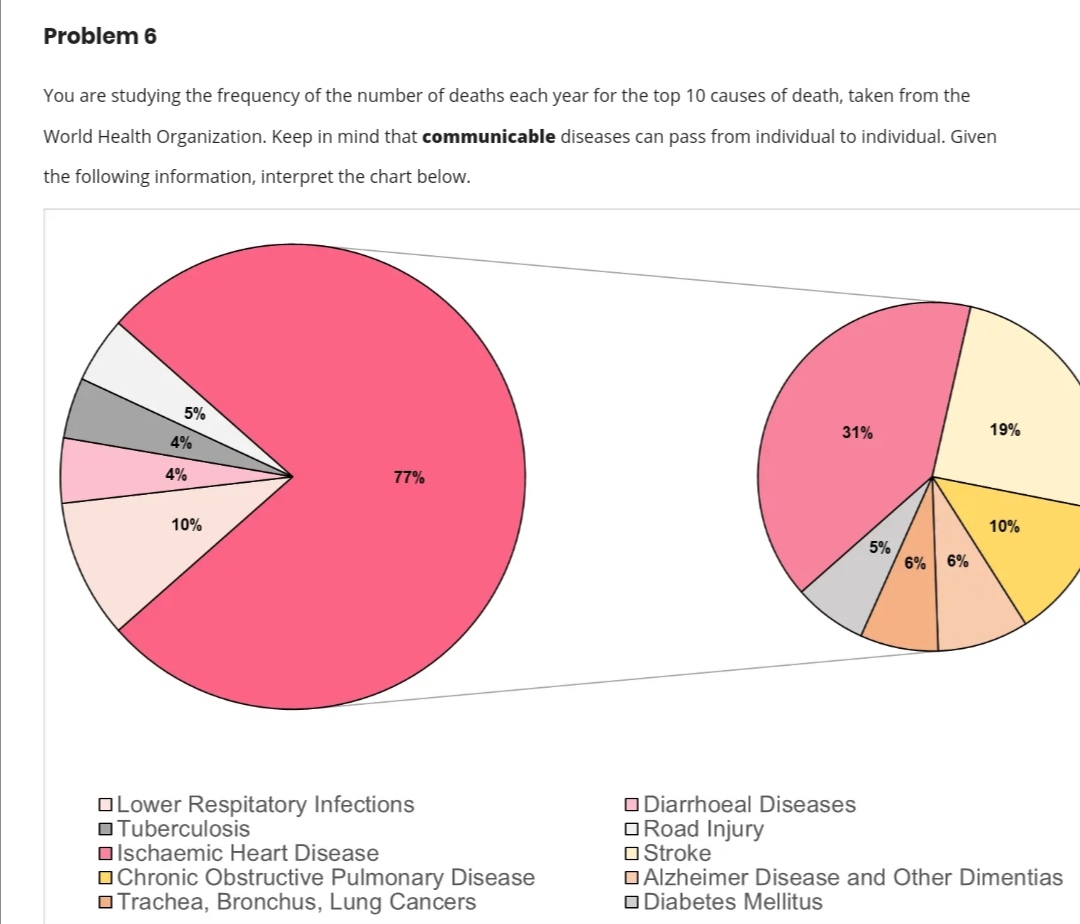
Problem 1 A study has shown that males in the UK have steadily grown in height from the 1800s to 1980. Based on the data below, find the mean height for each sixty-year period. Then, choose an appropriate chart or plot to visualize this data. Year Height in Cm 1810 169.7 1820 169.1 1830 166.7 1840 166.5 1850 165.6 1860 166.6 1870 167.2 1880 168 1890 167.4 1900 169.4 1910 170.9 1920 171 1930 173.9 1940 174.9 1950 176 1960 176.9 1970 177.1 1980 176.8Problem 2 There are multiple data sources on the subject you are currently studying - weights of students in college. You're interested in data that has low variability and a large sample size, the problem is that the data you found isn't in kilograms but in pounds. Using variance and standard deviation in pounds (1 kg = 2.20462 lb), which data set out of the following would you choose? Measure Data Set A Data Set B Data Set C Sample Size 15 670 4 500 9 334 Mean 550 464 534 Standard Deviation 432 140 210Problem 3 You want to investigate the average amount of time people aged 20 to 40 spend on the phone each week. Interpret the chart below by finding the group mean of the hours spent on the phone. Age Hours 20-22 45 23-25 36 26-28 25 29-31 16 32-34 12 35-37 8.5 38-40 4 50 45 40 35 30 25 20 15 10 O 20-22 23-25 26-28 29-31 32-34 35-37 38-40Problem 4 You're thinking about buying a new computer and are Interested in looking at the price of computers on the market Your budget is between 400 and 600 pounds. What percentage of the computers on the market are between your price range given the information below? Mean Price of Computers on the Market 540 pounds SD of Computers on the Market 120 pounds Problem 5 You are studying the differences of the distributions of streams on a popular music streaming service called Dotify. You find the following chart in a report that studies the number of streams during the first quarter of the year. Interpret the chart using the table provided, measures of central tendency and variability. Keep in mind the data are in thousands. January February March Q0 90 65 85 01 120 90 115 Q2 130 100 125 Q3 140 110 135 Q4 160 125 155 170 150 130 110 90 70 50 Jan Feb MarProblem 6 You are studying the frequency of the number of deaths each year for the top 10 causes of death, taken from the World Health Organization. Keep in mind that communicable diseases can pass from individual to individual. Given the following information, interpret the chart below. 5% 31% 19% 4% 4% 77% 10% 10% 5% 6% 6% O Lower Respitatory Infections O Diarrhoeal Diseases Tuberculosis O Road Injury OIschaemic Heart Disease O Stroke Chronic Obstructive Pulmonary Disease O Alzheimer Disease and Other Dimentias O Trachea, Bronchus, Lung Cancers 0 Diabetes Mellitus
Step by Step Solution
There are 3 Steps involved in it

Get step-by-step solutions from verified subject matter experts