

Question: I need this for Data Communications: ALOHA and Slotted ALOHA Simulations In ALOHA and slotted ALOHA all ground stations transmit packets to a satellite. A
I need this for Data Communications:
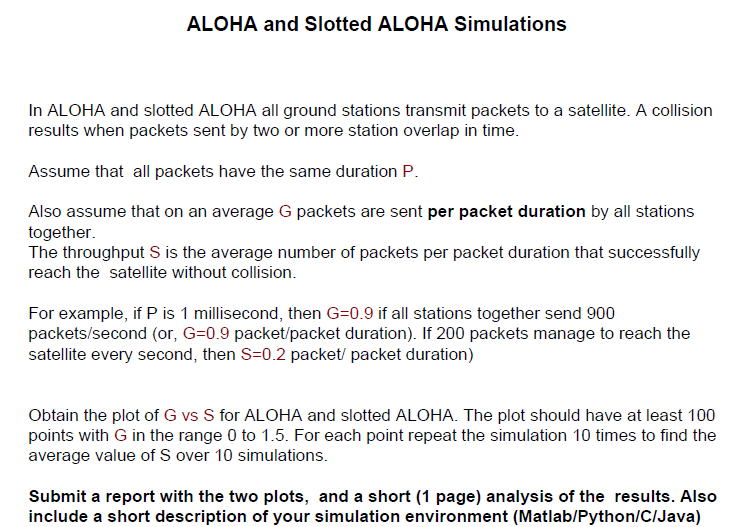
ALOHA and Slotted ALOHA Simulations In ALOHA and slotted ALOHA all ground stations transmit packets to a satellite. A collision results when packets sent by two or more station overlap in time. Assume that all packets have the same duration P. Also assume that on an average G packets are sent per packet duration by all stations together. The throughput S is the average number of packets per packet duration that successfully reach the satellite without collision For example, if P is 1 millisecond, then G 0.9 if all stations together send 900 packets/second (or, G=0.9 packet/packet duration). 11200 packets manage to reach the satellite every second, then S-0.2 packet/ packet duration) Obtain the plot of G vs S for ALOHA and slotted ALOHA. The plot should have at least 100 points with G in the range 0 to 1.5. For each point repeat the simulation 10 times to find the average value of S over 10 simulations. Submit a report with the two plots, and a short (1 page) analysis of the results. Also include a short description of your simulation environment (Matlab/Python/ClJava) ALOHA and Slotted ALOHA Simulations In ALOHA and slotted ALOHA all ground stations transmit packets to a satellite. A collision results when packets sent by two or more station overlap in time. Assume that all packets have the same duration P. Also assume that on an average G packets are sent per packet duration by all stations together. The throughput S is the average number of packets per packet duration that successfully reach the satellite without collision For example, if P is 1 millisecond, then G 0.9 if all stations together send 900 packets/second (or, G=0.9 packet/packet duration). 11200 packets manage to reach the satellite every second, then S-0.2 packet/ packet duration) Obtain the plot of G vs S for ALOHA and slotted ALOHA. The plot should have at least 100 points with G in the range 0 to 1.5. For each point repeat the simulation 10 times to find the average value of S over 10 simulations. Submit a report with the two plots, and a short (1 page) analysis of the results. Also include a short description of your simulation environment (Matlab/Python/ClJava)
Step by Step Solution
There are 3 Steps involved in it

Get step-by-step solutions from verified subject matter experts