

Question: i need this in R , i have only one hour ... Question 2: The following shows the distribution of customers satisfaction about a product
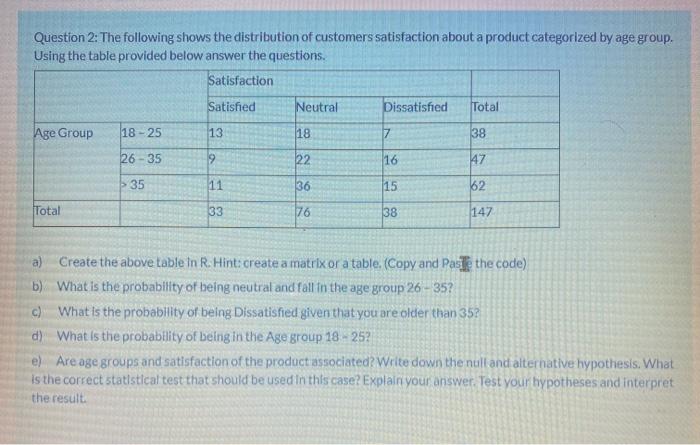
Question 2: The following shows the distribution of customers satisfaction about a product categorized by age group. Using the table provided below answer the questions. Satisfaction Satisfied Neutral Dissatisfied Total Age Group 18 - 25 13 18 7 38 26 - 35 19 22 16 47 35 11 36 15 62 Total 33 76 38 147 a) Create the above table in R. Hints create a matrix or a table. (Copy and paste the code) b) What is the probability of being neutral and fall in the age group 26-35? c) What is the probability of being Dissatisfied given that you are older than 35? d) What is the probability of being in the Age group 18 - 25? e) Are age groups and satisfaction of the product associated? Write down the null and alternative hypothesis. What is the correct statistical test that should be used in this case? Explain your answer. Test your hypotheses and interpret the result
Step by Step Solution
There are 3 Steps involved in it

Get step-by-step solutions from verified subject matter experts