

Question: i need this in to be a page please I just need these two data tables explained to me. Relate pairs of variables by studying
i need this in to be a page please 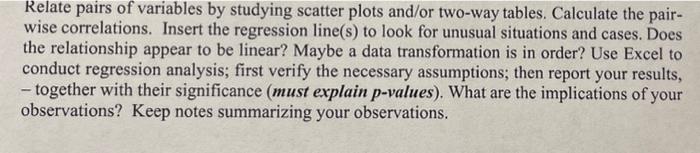
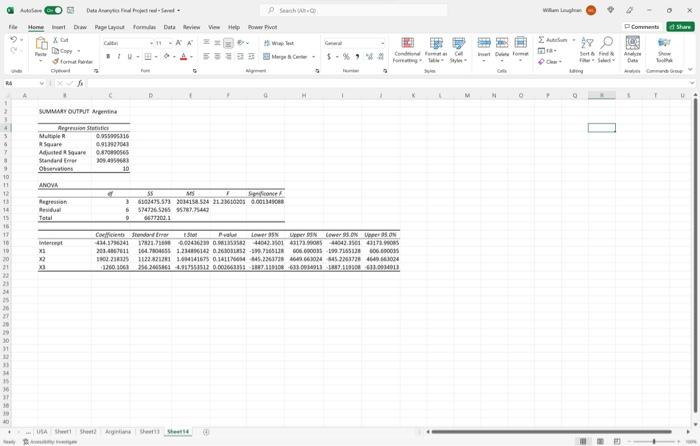
I just need these two data tables explained to me. 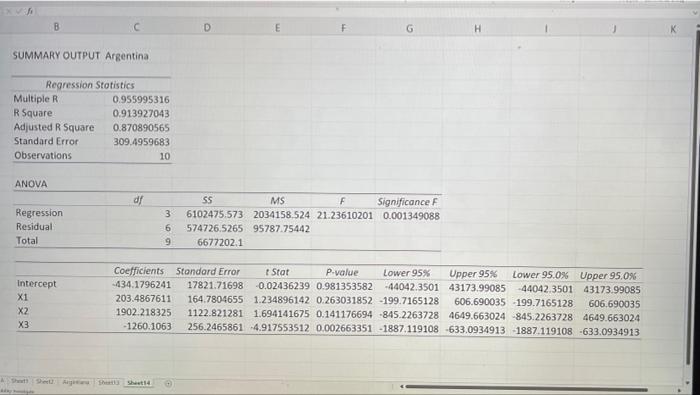
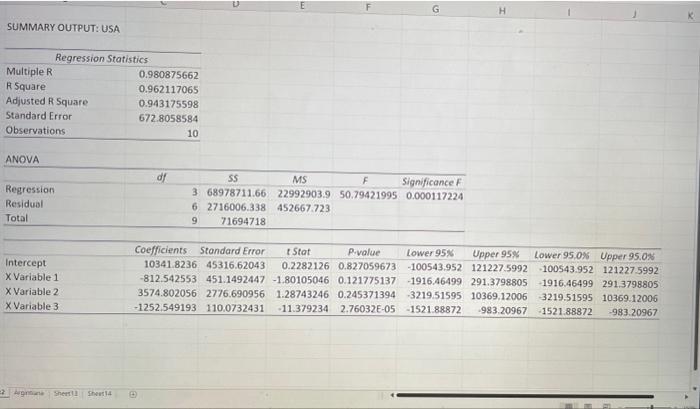
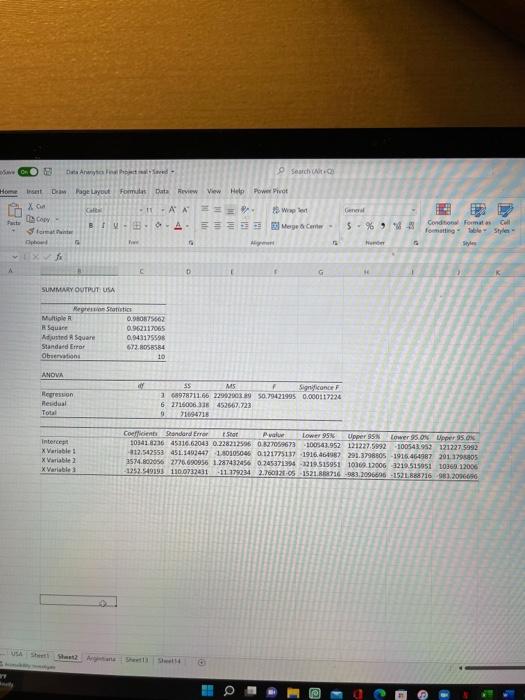
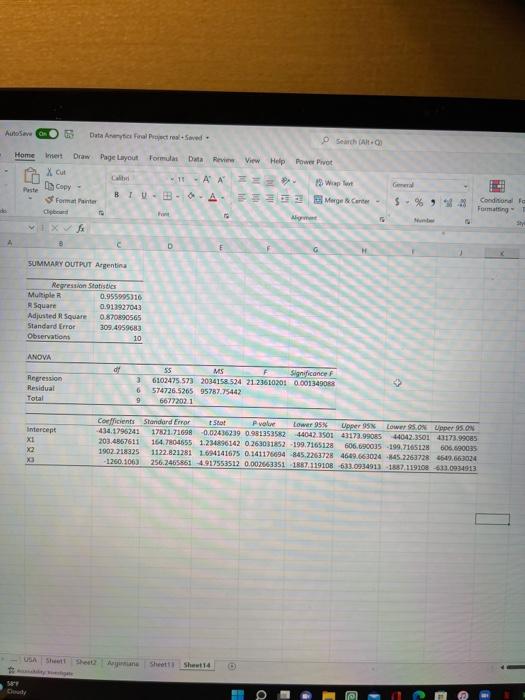
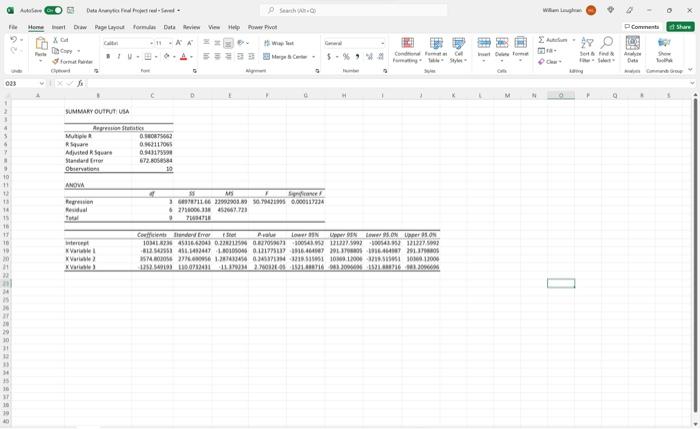
Relate pairs of variables by studying scatter plots and/or two-way tables. Calculate the pair- wise correlations. Insert the regression line(s) to look for unusual situations and cases. Does the relationship appear to be linear? Maybe a data transformation is in order? Use Excel to conduct regression analysis; first verify the necessary assumptions; then report your results, - together with their significance (must explain p-values). What are the implications of your observations? Keep notes summarizing your observations. Data Awitch search to Home Dr Page Layout Fome Data Review View Hel Power Pivot Loan Gel hy -- AA Wwert BIOA 3 Mege Care - 5% 982 fra Conditions Format cu foeting stolen Style X D G SUMMARY OUTPUT USA Multiple R Square Adjusted Square Standard Error Observa 0.980875662 0.962117065 0.943175598 672.8058584 10 ANOVA Regression Residual Total 35 MS Significance 168978711.06 2296200389 50.79421905 0.000117226 6 2716006.316 452667.723 9 78694713 Intercept X Variable X Variable 2 X Variable Coefits Standard Error Ava Lower 95 Upper Lower ONLpper 95.ON 10341 8236 45116.62043 0.228212506 0827059673100541.952 121227.5092 -10054121212275092 -312.542958 451.1492447 180105046 0.121775137 1916.461987 291.3798805 1916.464987 201790 2574.820562776.690956 1.287432456 0245371394-3219515951 1006912006 3219515051 1016.1.2006 1252.549195 110.0732431 11 779234 2.76012-05-1521 716 -983.1096.06-1521883215981.20060 Q Auto Data Artis Fral Project real Seed Search ARO Home iment Draw Page Layout Format Data Review View Help Power Pivot Xcut Cal -1-A 2 W H li Cooy - BIB-O A Merges Carter format Peste Ger $ % ) Conditional for Formatting fo D G SUMMARY OUTPUT Argentina Regression Statistics Multiple 0.955995316 Square 0.911927043 Adjusted R Square 0.870890565 Standard Error 309.4959683 Observations 10 ANOVA dr Regression Residual 3 6 9 55 MS Significance F 6102475.573 2034158524 21 23610201 0.001349088 5747265265 95787.75442 66772021 Total Intercept XI X2 XO Coefficients Standard Error Star Puolue Lower 95% Upper 95 Lower S.ONE per.ON -434.1796241 171.71698 0.02436239 0.931353582 44042.350149173.99035 44042.3501 43173.98085 203.4867611 164.7804655 1.234896142 0.263031852-199.7165128 606.690015 -199,7105128 506.890035 1902 218325 1122.821281 1694141675 0.141176594 845.2263728 4649.663004 145.2263728 4549.663024 -1.260.1063 256,24658634917553512 0.002663351 1867 11910863309349131887119108-61.0034913 USA Sheet Det Sheet Sheet14 50 Guy Scho Cond Sur wowy pod MOH POY BELLES | 9 ENERO She SA De format To 5 . G 120 SUMMARY OUTPUT US Aegon States MUTO Rare 09117085 Mited 0843178990 Standard 672.54 Observation 19 3 10 11 WONY V YA VEL0000 SONGS TOGSTE OVERDE 13 edel 276006138 45702721 00012 NGENTOT NO E NO MANGA KV IOMETH493364704022 TOMT 30 3 171221 12.5429 431141147 11010100 01 MBT OLANT 1.17 WAX coor HELLO WORRETNIE WOW WE WRITTEN WOW WHITE ONIONE ET HERZOGI - g_ga2 Cord Shure 0.-3 D. BELES 9 Dome Sert Are She off SUMMARY OUTPUT STESSO Argestions Multiple Soare 6.912927041 Adjusted 0.87000055 Standard 104952683 Observations 10 ANOMA 10 n 12 13 14 15 16 Rape Real Total SS M 3 6103475.57 2014158,524 212360203 0.00134908 $14726526595767.75443 48322001 9 TX ex EX Cortowo LON per 9 wr 93.095.0N 334.373341 17421.71000432 0.0115351244042.301 45173.ORS 48042.11 GT. VIONS 203.63671 12142 -32.706138 0.0003109.7065128 400.000 1800238335 1122.212.341675 0.0145.2202734422738 4649.6024 20.02.2004.08.2012 D.CREASES-COTOBACIL.COM 22 USA het short She 44 D E F G H K SUMMARY OUTPUT Argentina Regression Statistics Multiple R 0.955995316 R Square 0.913927043 Adjusted R Square 0.870890565 Standard Error 309.4959683 Observations 10 ANOVA dy Regression Residual Total 3 6 9 SS MS F Significance 6102475.573 2034158.524 21.23610201 0.001349088 574726.5265 9578775442 6677202.1 Intercept X1 X2 X3 Coefficients Standard Error Star P-value Lower 95% Upper 95% Lower 95.0% Upper 95.0% -434.1796241 17821.71698 -0.02436239 0.981353582 44042.3501 43173.99085 -44042.3501 43173.99085 203.4867611 164.7804655 1.234896142 0.263031852-199.7165128 606.690035 199.7165128 606,690035 1902.218325 1122.821281 1.694141675 0.141176694 845.2263728 4649.663024 845.2263728 4649.663024 -1260.1063 256.2465861 -4.917553512 0.002663351 -1887.119108 -633.0934913 1887.119108 -633.0934913 G H SUMMARY OUTPUT: USA Regression Statistics Multiple R 0.980875662 R Square 0.962117065 Adjusted R Square 0.943175598 Standard Error 672.8058584 Observations 10 ANOVA df Regression Residual Total SS MS F Significance 3 68978711.66 22992903.9 50.79421995 0.000117224 6 2716006.338 452667 723 9 71694718 Intercept X Variable 1 X Variable 2 X Variable 3 Coefficients Standard Error Stat P-value Lower 95% Upper 95% Lower 95.0% Upper 95.0% 10341.8236 45316.62043 0.2282126 0.827059673100543.952 121227.5992 100543.952 121227.5992 -812.542553 451.1492447 -1.80105046 0.121775137 1916 46499 291.3798805 1916.46499 291.3798805 3574.802056 2776.690956 1.28743246 0.245371394 3219.51595 10369,12006 3219.51595 10369.12006 -1252.549193 110.0732431 -11.379234 2.76032E-05-1521.88872 -983,20967 -1521.88872 -983.20967 ? Sheet Shetla
Step by Step Solution
There are 3 Steps involved in it
1 Expert Approved Answer
Step: 1 Unlock

Question Has Been Solved by an Expert!
Get step-by-step solutions from verified subject matter experts
Step: 2 Unlock
Step: 3 Unlock