

Question: I need this question solved step by step and can't find a solution for it Problems 6 and 7 refer to the data contained in
I need this question solved step by step and can't find a solution for it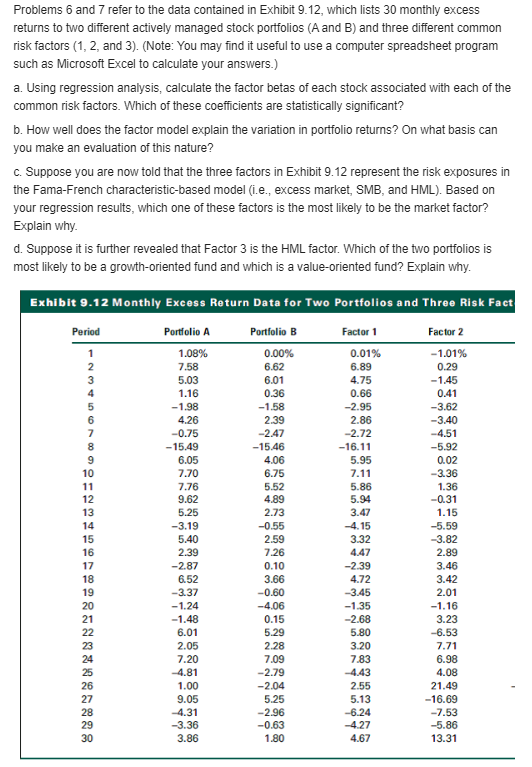
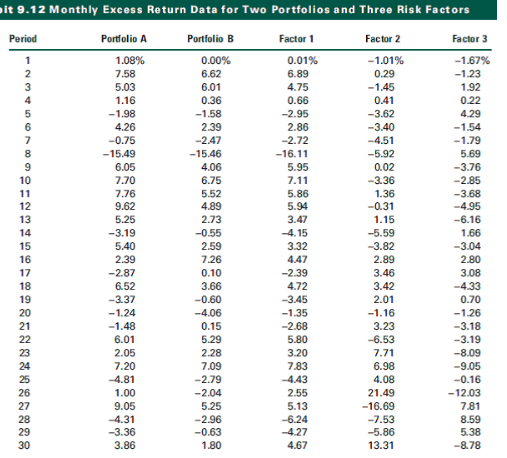
Problems 6 and 7 refer to the data contained in Exhibit 9.12, which lists 30 monthly excess returns to two different actively managed stock portfolios (A and B) and three different common risk factors (1, 2 and 3). (Note: You may find it useful to use a computer spreadsheet program such as Microsoft Excel to calculate your answers.) a. Using regression analysis, calculate the factor betas of each stock associated with each of the common risk factors. Which of these coefficients are statistically significant? b. How well does the factor model explain the variation in portfolio returns? On what basis can you make an evaluation of this nature? C. Suppose you are now told that the three factors in Exhibit 9.12 represent the risk exposures in the Fama-French characteristic-based model i.e., excess market, SMB, and HML). Based on your regression results, which one of these factors is the most likely to be the market factor? Explain why d. Suppose it is further revealed that Factor 3 is the HML factor. Which of the two portfolios is most likely to be a growth-oriented fund and which is a value-oriented fund? Explain why. Exhibit 9.12 Monthly Excess Return Data for Two Portfolios and Three Risk Fact Period Portfolio Portfolio B Factor 1 Factor 2 0.00% 6.62 6.01 0.36 -1.58 2.39 -2.47 -15.46 4.06 6.75 5.52 4.89 2.73 -0.55 0.01% 6.89 4.75 0.66 -2.95 2.86 -2.72 -16.11 5.95 1.08% 7.58 5.03 1.16 -1.98 4.26 -0.75 -15.49 6.05 7.70 7.76 9.62 5.25 -3.19 5.40 2.39 -2.87 6.52 -3.37 -1.24 -1.48 6.01 2.05 7.20 4.81 1.00 9.05 -4.31 -3.36 3.86 7.26 0.10 3.66 -0.60 -4.06 0.15 5.29 2.28 7.09 -2.79 -2.04 5.25 -2.96 -0.63 1.80 7.11 5.86 5.94 3.47 -4.15 3.32 4.47 -2.39 4.72 -3.45 -1.35 -2.68 5.80 3.20 7.83 -4.43 2.55 5.13 -6.24 4.27 -1.01% 0.29 -1.45 0.41 -3.62 -3.40 -4.51 -5.92 0.02 -3.36 1.36 -0.31 1.15 -5.59 -3.82 2.89 3.46 3.42 2.01 -1.16 3.23 -6.53 7.71 6.98 4.08 21.49 -16.69 -7.53 -5.86 13.31 4.67 it 9.12 Monthly Excess Return Data for Two Portfolios and Three Risk Factors Period Factor 2 Factor 3 Portfolio A 1.08% 7.58 5.03 1.16 -1.98 4.26 -0.75 -15.49 6.05 7.70 7.76 9.62 5.25 -3.19 5.40 2.39 -2.87 6.52 -3.37 -1.24 -1.48 6.01 2.05 7.20 4.81 1.00 9.05 4.31 -3.36 3.86 Portfolio B 0.00% 6.62 6.01 0.36 -1.58 2.39 -2.47 -15.46 4.06 6.75 5.52 4.89 2.73 -0.55 2.59 7.26 0.10 3.66 -0.60 -4.06 0.15 5.29 2.28 7.09 -2.79 -2.04 Factor 1 0.01% 6.89 4.75 0.66 -2.95 2.86 -2.72 -16.11 5.95 7.11 5.86 5.94 3.47 4.15 3.32 4.47 -2.39 4.72 -3.45 -1.35 -2.68 5.80 3.20 7.83 -4.43 2.55 5.13 -6.24 -1.01% 0.29 -1.45 0.41 -3.62 -3.40 -4.51 -5.92 0.02 -3.36 1.36 -0.31 1.15 -5.59 -3.82 2.89 3.46 3.42 2.01 -1.16 3.23 -6.53 7.71 6.98 4.08 21.49 -16.69 -7.53 -5.86 13.31 -1.67% -1.23 1.92 0.22 4.29 -1.54 -1.79 5.69 -3.76 -2.85 -3.68 -4.95 -6.16 1.66 -3.04 2.80 3.08 -4.33 0.70 -1.26 -3.18 -3.19 -8.09 -9.05 -0.16 - 12.03 7.81 8.59 5.25 -2.96 -0.63 1.80 28 Problems 6 and 7 refer to the data contained in Exhibit 9.12, which lists 30 monthly excess returns to two different actively managed stock portfolios (A and B) and three different common risk factors (1, 2 and 3). (Note: You may find it useful to use a computer spreadsheet program such as Microsoft Excel to calculate your answers.) a. Using regression analysis, calculate the factor betas of each stock associated with each of the common risk factors. Which of these coefficients are statistically significant? b. How well does the factor model explain the variation in portfolio returns? On what basis can you make an evaluation of this nature? C. Suppose you are now told that the three factors in Exhibit 9.12 represent the risk exposures in the Fama-French characteristic-based model i.e., excess market, SMB, and HML). Based on your regression results, which one of these factors is the most likely to be the market factor? Explain why d. Suppose it is further revealed that Factor 3 is the HML factor. Which of the two portfolios is most likely to be a growth-oriented fund and which is a value-oriented fund? Explain why. Exhibit 9.12 Monthly Excess Return Data for Two Portfolios and Three Risk Fact Period Portfolio Portfolio B Factor 1 Factor 2 0.00% 6.62 6.01 0.36 -1.58 2.39 -2.47 -15.46 4.06 6.75 5.52 4.89 2.73 -0.55 0.01% 6.89 4.75 0.66 -2.95 2.86 -2.72 -16.11 5.95 1.08% 7.58 5.03 1.16 -1.98 4.26 -0.75 -15.49 6.05 7.70 7.76 9.62 5.25 -3.19 5.40 2.39 -2.87 6.52 -3.37 -1.24 -1.48 6.01 2.05 7.20 4.81 1.00 9.05 -4.31 -3.36 3.86 7.26 0.10 3.66 -0.60 -4.06 0.15 5.29 2.28 7.09 -2.79 -2.04 5.25 -2.96 -0.63 1.80 7.11 5.86 5.94 3.47 -4.15 3.32 4.47 -2.39 4.72 -3.45 -1.35 -2.68 5.80 3.20 7.83 -4.43 2.55 5.13 -6.24 4.27 -1.01% 0.29 -1.45 0.41 -3.62 -3.40 -4.51 -5.92 0.02 -3.36 1.36 -0.31 1.15 -5.59 -3.82 2.89 3.46 3.42 2.01 -1.16 3.23 -6.53 7.71 6.98 4.08 21.49 -16.69 -7.53 -5.86 13.31 4.67 it 9.12 Monthly Excess Return Data for Two Portfolios and Three Risk Factors Period Factor 2 Factor 3 Portfolio A 1.08% 7.58 5.03 1.16 -1.98 4.26 -0.75 -15.49 6.05 7.70 7.76 9.62 5.25 -3.19 5.40 2.39 -2.87 6.52 -3.37 -1.24 -1.48 6.01 2.05 7.20 4.81 1.00 9.05 4.31 -3.36 3.86 Portfolio B 0.00% 6.62 6.01 0.36 -1.58 2.39 -2.47 -15.46 4.06 6.75 5.52 4.89 2.73 -0.55 2.59 7.26 0.10 3.66 -0.60 -4.06 0.15 5.29 2.28 7.09 -2.79 -2.04 Factor 1 0.01% 6.89 4.75 0.66 -2.95 2.86 -2.72 -16.11 5.95 7.11 5.86 5.94 3.47 4.15 3.32 4.47 -2.39 4.72 -3.45 -1.35 -2.68 5.80 3.20 7.83 -4.43 2.55 5.13 -6.24 -1.01% 0.29 -1.45 0.41 -3.62 -3.40 -4.51 -5.92 0.02 -3.36 1.36 -0.31 1.15 -5.59 -3.82 2.89 3.46 3.42 2.01 -1.16 3.23 -6.53 7.71 6.98 4.08 21.49 -16.69 -7.53 -5.86 13.31 -1.67% -1.23 1.92 0.22 4.29 -1.54 -1.79 5.69 -3.76 -2.85 -3.68 -4.95 -6.16 1.66 -3.04 2.80 3.08 -4.33 0.70 -1.26 -3.18 -3.19 -8.09 -9.05 -0.16 - 12.03 7.81 8.59 5.25 -2.96 -0.63 1.80 28
Step by Step Solution
There are 3 Steps involved in it

Get step-by-step solutions from verified subject matter experts