

Question: I need this question to be solved write your Observe of what happens to the graph, MAD, MSE. A) The sales data of company for
I need this question to be solved write your Observe of what happens to the graph, MAD, MSE.
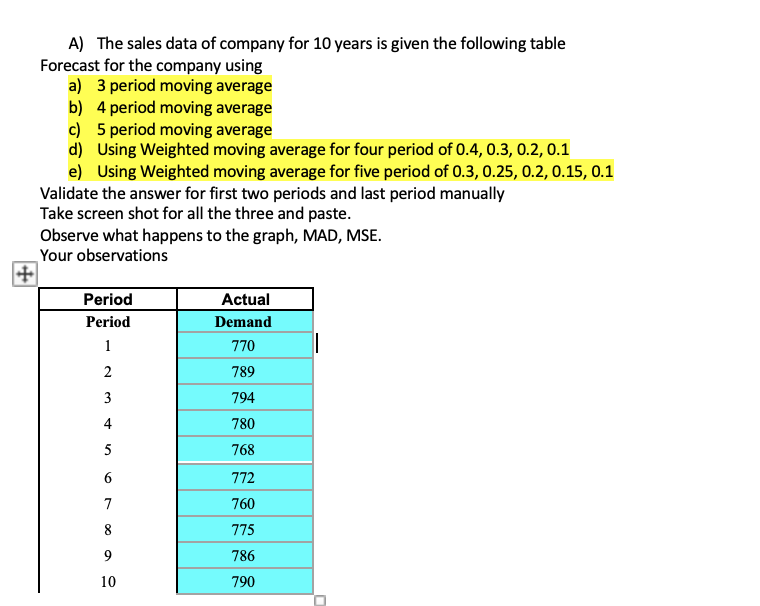
A) The sales data of company for 10 years is given the following table Forecast for the company using a) 3 period moving average b) 4 period moving average c) 5 period moving average d) Using Weighted moving average for four period of 0.4, 0.3, 0.2, 0.1 e) Using Weighted moving average for five period of 0.3, 0.25, 0.2, 0.15, 0.1 Validate the answer for first two periods and last period manually Take screen shot for all the three and paste. Observe what happens to the graph, MAD, MSE. Your observations + Period Period 1 2 Actual Demand 770 789 3 794 4 780 5 6 768 772 760 775 7 8 9 786 10 790Step by Step Solution
There are 3 Steps involved in it
1 Expert Approved Answer
Step: 1 Unlock

Question Has Been Solved by an Expert!
Get step-by-step solutions from verified subject matter experts
Step: 2 Unlock
Step: 3 Unlock