

Question: I need to annotate this plot to show where the sinusoid is, how would i code this in Python 3.6 with matplotlib? plt.ylabel ( 'Welch
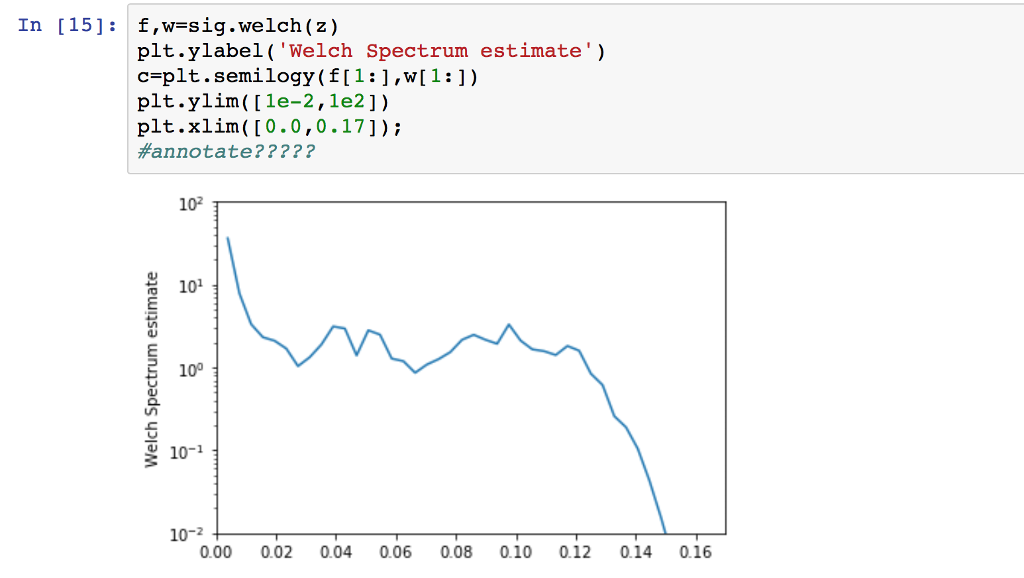 I need to annotate this plot to show where the sinusoid is, how would i code this in Python 3.6 with matplotlib?
plt.ylabel ( 'Welch Spectrum estimate') 1 plt.ylim([le-2,1e2]) plt.xlim([0.0,0.17]) #annotate? ? ? ? ? 2 102 101 10 102 0.00 0.02 0.04 0.06 0.08 0.10 012 0.14 0.16
Step by Step Solution
There are 3 Steps involved in it
1 Expert Approved Answer
Step: 1 Unlock

Question Has Been Solved by an Expert!
Get step-by-step solutions from verified subject matter experts
Step: 2 Unlock
Step: 3 Unlock