

Question: I need to be able to fill in the excel spreadsheet below with correct answers. The last person who answered my question didn't answer in
I need to be able to fill in the excel spreadsheet below with correct answers. The last person who answered my question didn't answer in away that help with the excel.
- Claim: the average age of online students is 32 years old. Can you prove it is not?
- What is the null hypothesis?
- What is the alternative hypothesis?
- What distribution should be used?
- What is the test statistic?
- What is the p-value?
- What is the conclusion?
- How do we interpret the results, in context of our study?
- Claim: the proportion of males in online classes is 35%. Can you prove it is not?
- What is the null hypothesis?
- What is the alternative hypothesis?
- What distribution should be used?
- What is the test statistic?
- What is the p-value?
- What is the conclusion?
- How do we interpret the results, in context of our study?
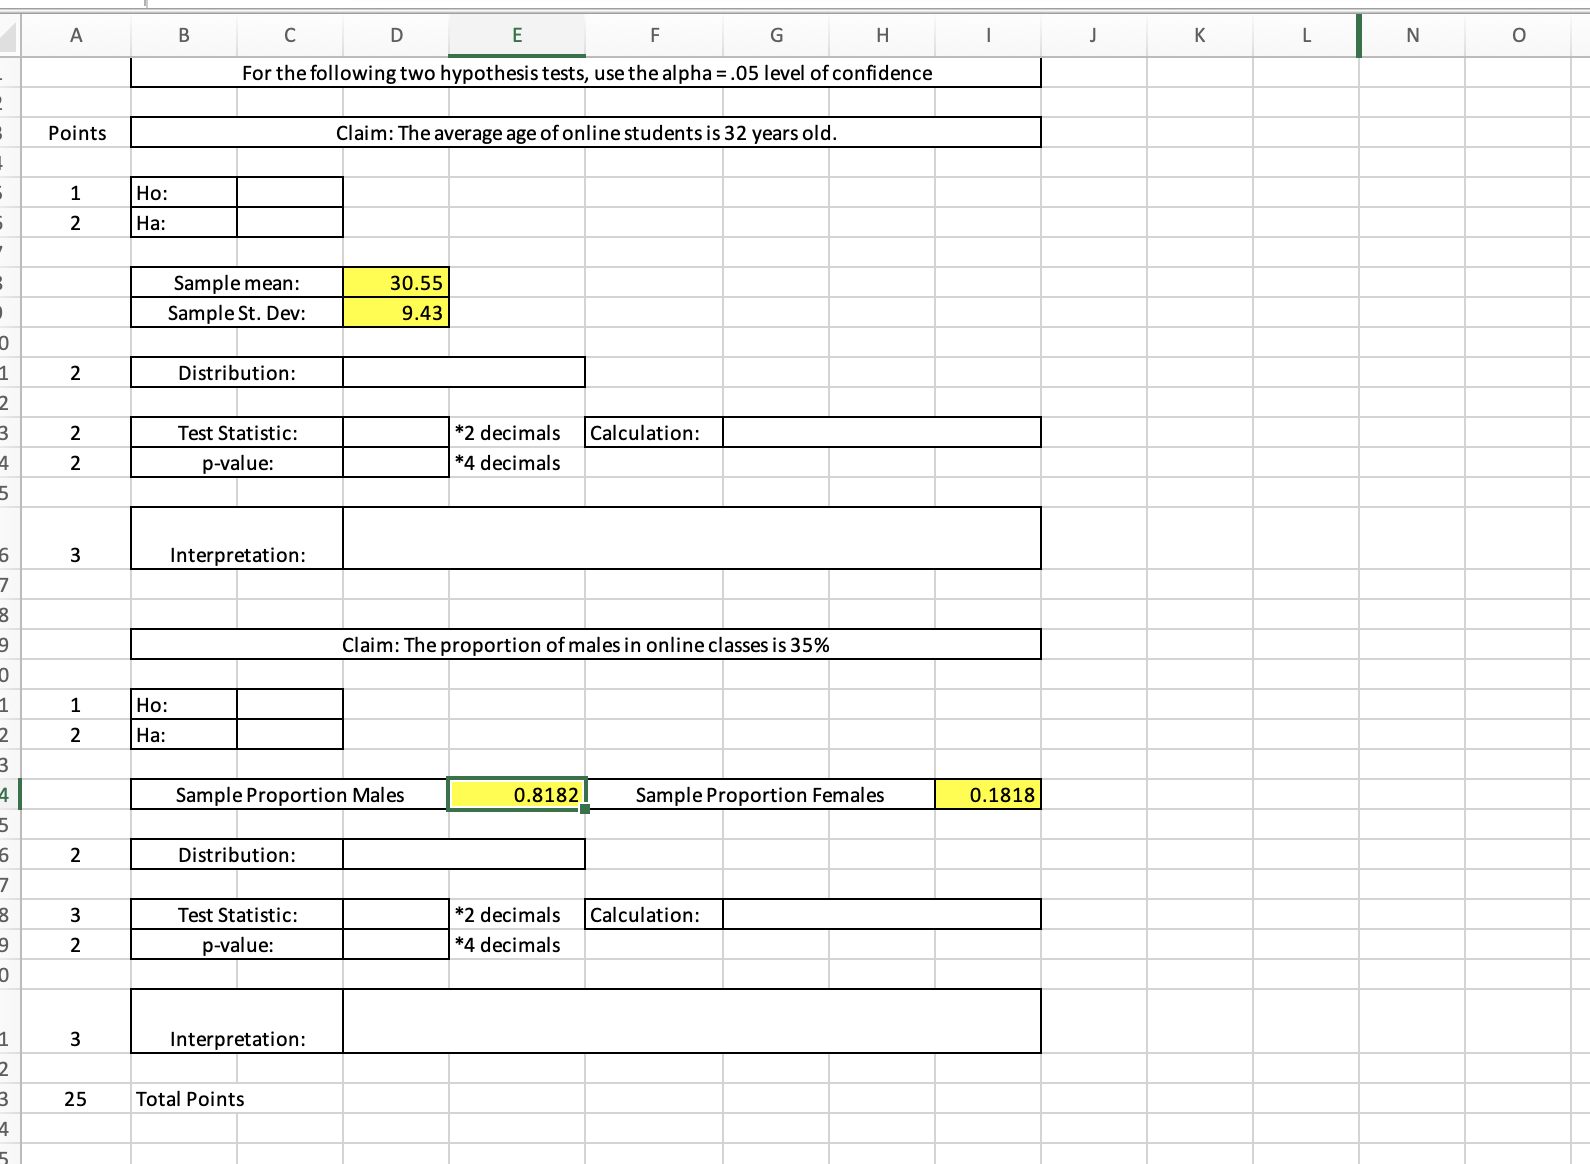
A B C D E F G H K L N O For the following two hypothesis tests, use the alpha = .05 level of confidence Points Claim: The average age of online students is 32 years old. Ho: Ha: Sample mean: 30.55 Sample St. Dev: 9.43 2 Distribution: Test Statistic: *2 decimals |Calculation: NN p-value *4 decimals W Interpretation: Claim: The proportion of males in online classes is 35% Ho: Ha: Sample Proportion Males 0.8182 Sample Proportion Females 0.1818 N Distribution: Test Statistic: *2 decimals |Calculation: NW -value: *4 decimals W Interpretation: 25
Step by Step Solution
There are 3 Steps involved in it

Get step-by-step solutions from verified subject matter experts