Question: i need to calculate forecast accuracy for initial data with forecast for these 3 secrions in highlighted boxes 1: bias high 2: no bias 3:

i need to calculate forecast accuracy for "initial data with forecast for these 3 secrions in highlighted boxes
1: bias high
2: no bias
3: bis low i need to calculate forecast accuracy for
(50,30,20) data points Forecast History 1 2 3 4 Actual Demand 10,000 11,200 12,500 9,500 10,700 5,380 14,340 11,250 10,250 11,900 5 Initial Data 6 11610 10740 10700 7800 10924 11003 11368 11275 7 8 9 10 Period #11 11935 11039 Initial Data with Forecast 10,000 11,200 12,500 9,500 10,700 5,380 14,340 11,250 10,250 11,900 9000 10000 11200 12500 9500 10700 5380 15000 11000 10000 Total MAPE Forcast Bias Using above 10 actual and forecast data points - hand draw a forecast bias chart - no bias/accurate forecast is +/- 59 Blas high No Bias Bias Low (50,30,20) data points Forecast History 1 2 3 4 Actual Demand 10,000 11,200 12,500 9,500 10,700 5,380 14,340 11,250 10,250 11,900 5 Initial Data 6 11610 10740 10700 7800 10924 11003 11368 11275 7 8 9 10 Period #11 11935 11039 Initial Data with Forecast 10,000 11,200 12,500 9,500 10,700 5,380 14,340 11,250 10,250 11,900 9000 10000 11200 12500 9500 10700 5380 15000 11000 10000 Total MAPE Forcast Bias Using above 10 actual and forecast data points - hand draw a forecast bias chart - no bias/accurate forecast is +/- 59 Blas high No Bias Bias Low

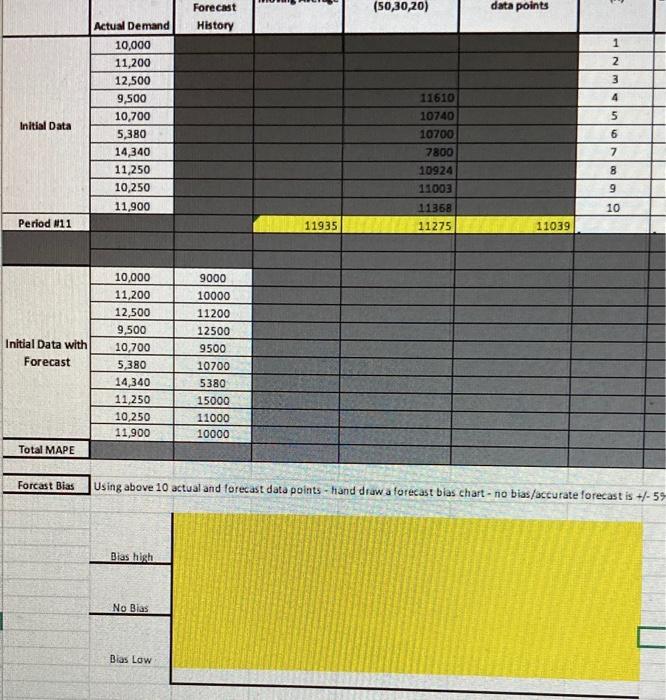
Step by Step Solution

There are 3 Steps involved in it

1 Expert Approved Answer
Step: 1 Unlock blur-text-image
Question Has Been Solved by an Expert!

Get step-by-step solutions from verified subject matter experts

Step: 2 Unlock
Step: 3 Unlock

Students Have Also Explored These Related General Management Questions!