Question: i need to create a two-way table is a table with this info of the new screening tool two rows and two columns. In addition,
i need to create a two-way table is a table with this info of the "new screening tool" two rows and two columns.
In addition, I also need a cut-off value. A cut-off value tells you which value will determine when further testing is needing. Can someone please help with this?
the directions of what they are wanting is below. what i submitted was wrong.

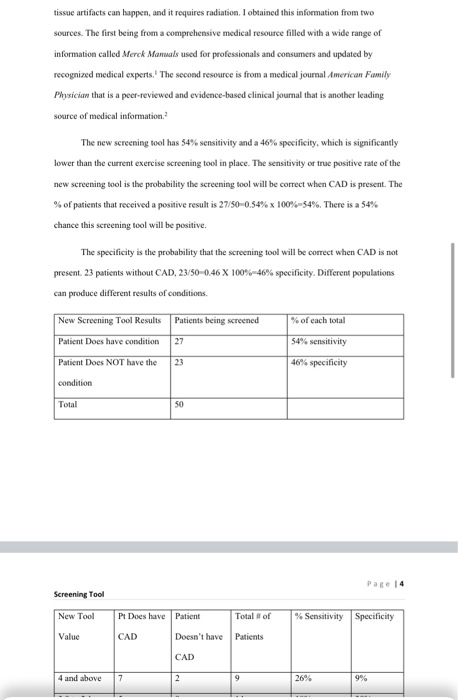
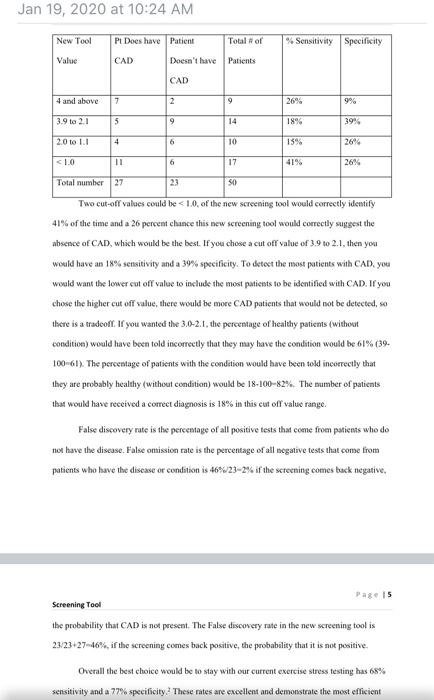
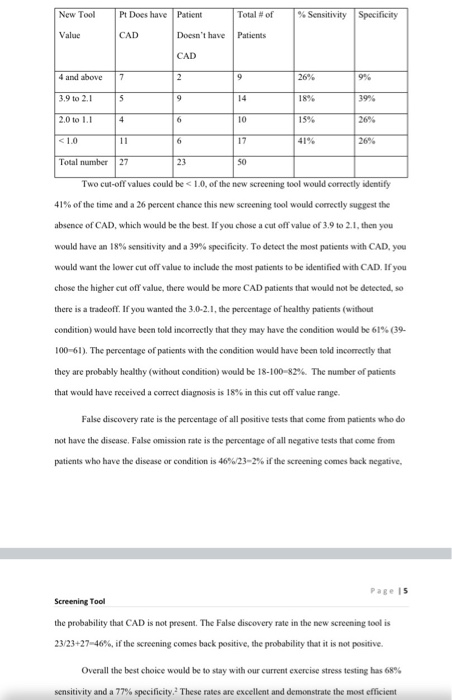
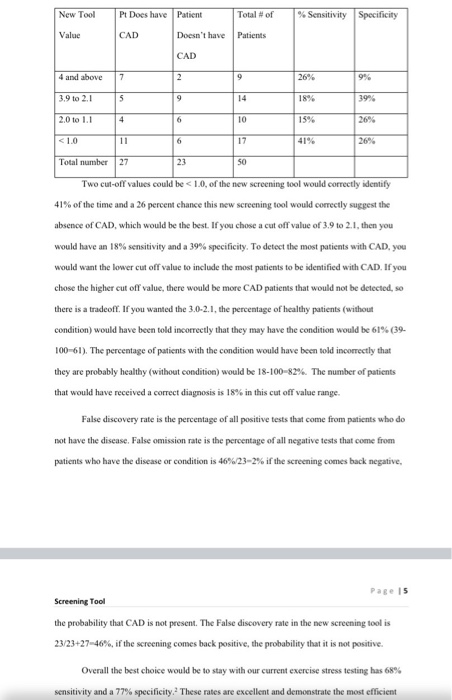
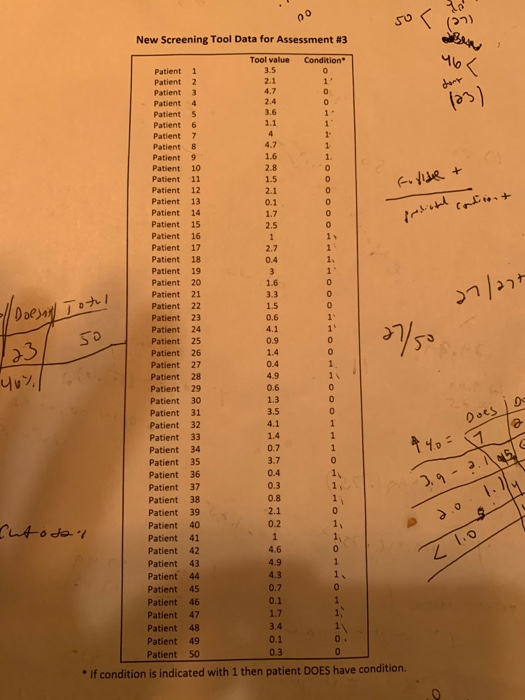
New Screening Tool Data for Assessment #3 Tool value Condition 3.5 Patient 2.1 Patient Patient darr 4.7 2.4 Patient 3.6 1- Patient 1.1 Patient 1. Patient 4.7 1. Patient 1.6 Patient 9. 1. 2.8 Patient 10 Patient 11 1.5 fodide + Patient 12 2.1 Patient 13 0.1 coiion+ Patient 14 1.7 Patient 15 2.5 Patient 16 1s Patient 17 2.7 Patient 18 1. 0.4 1' Patient 19 Patient 20 1.6 |* Patient 21 3.3 22 1.5 Patient Doesa Totl Patient 23 0.6 Patient 24 4.1 50 23, yu%./ 25 0.9 Patient 1.4 Patient 26 S/he 27 0.4 Patient 4.9 11 Patient 28 0.6 29 Patient 1.3 30 Patient Patient Patient 33 3.5 31 Does 4.1 32 1.4 Patient 0.7 Patient 34 3.7 35 Patient 0.4 36 Patient , - . 0.3 1, 1) 37 Patient 0.8 Patient 39 38 2.1 Patient 40 0.2 1, Cutodal Patient 41 Patient 4.6 Patient 42 4.9 Patient 43 4.3 1. Patient 44 0.7 45 Patient 0.1 46 Patient 1. 1.7 Patient 47 3.4 Patient 48 0.1 49 Patient 0.3 50 Patient * If condition is indicated with 1 then patient DOES have condition. Use the data set in the Directions and Evaluation Rubric section for Assessment #3. The data set represents the results from patients testing a new version of the screening tool you chose above. You will need to analyze this patient data to detemine if the new screening tool is better than the one you chose from above that is currently in use. MATH 102X - Assessment #3 Guidelines and Scoring Rubric PART 2: Analyze a data set (continued) Determine two cut-off values for the data from the new screening tool. Create two-way tables to display your data. Determine the sensitivity and specificity based on each of the cut-off values you chose. Which cut-off value is better and why? Many people consider sensitivity and specificity as well as false discovery and false omission rates when discussing the effectiveness of a screening tool. Explain the false discovery and false omission rates. What would be the usefulness of each rate? Calculate these two rates for the data from the new screening tool. (Please note: These are NOT the same as false positive or false negative rates. Additional information can be found in the learning resources.) Directions: Read all hree parts to this project on pages 23 and he guidelines to get an overview of the assessment. The scoring rubric and detailed directions for this assessment are listed below. There are three parts to this project which must be completed in order. However, the three parts will not be tuned in. All of the information from the three parts should be included in the letter MATH 102X Assasament. Dicectiona and quidalines. 1. Review the directions and guideines for is assessment verycarefully. 2. Remember that the three parts to this project must all be completed and should be done in order. 3. Review the evaluation-scoring rubric noted below so that you are certain to include al required elements of his assessment 4. Carefully review the leaming resources noted in the Leaming Path for this assessment. We atrongy recommend that you use the resources in the leaming pah for this assessment working through all of the PNL problems for a particular lesson first, al of the problema within the lesson tself and then all of the comesponding OCE problems. The new vocabulary and caloulations make these resources important for the successful completion of his assessment. PowerPoints are provided for additional help with the problems within each lesson. Answers are also provided for all of the PNL and OCE practice problems. 5. You must submit this assessment using the comrect format for a professional leter. (Please note: A professional leter does NOT have a running head, which is only included for papers.) 6. You will need to conduct research to find addtional resources beyond those provided in this set to support your letter. Be certain that all references used in this assessment are property cited in the format of your discipline (APA for nursing and AMA for Healt Sciences) 7. There are three parts to this assessment which will aid you in considering the information needed for the leter. It is highly recommended that you complete all three parts before assembling your letter. However, allinformation should be in the letter. No additional paper is required or allowed. Your Academic Honesty Statement should be included as an appendix to the leter. 8. The mathematical concepts and procedures needed for Assessment 1 and Assessment #2 will help build a strong foundation for the skills you will leam for the other assessments. WE STRONGLY RECOMMEND THAT YOu COMPLETE WITH ASSESSMENT 1 AND ASSESSMENT #2 BEFORE ATTEMPTING THIS ASSESSMENT. A. While every student is different, most students find Assessment 3 takes about two weeks to complete. Ouderes and Soring Ru MATH 12x- Asenent Remember there are THREE parts to this project. The overal lask is to evaluate the effectiveness of a new screening tool. PART 1: Choose a sereening toel Below is a list of screeing tools that are used to detect the presence or absence of certain conditons. Pa one screening tosi and conduct some research to determine how effective it is. Find some information on the screening tools sersitivty and specificity. Note any other quanttative measures of ts effectiveness. State caretully where you obtained the information and why you beleve the source is relable () Mammograms are used to soreen for breast cancer. ) There is an ELISA (EnzymeLinked inmunosortert Assay) test developed to screen for the presence of HV, me virus that causes AIDS. (e) The FDA recently approved a new overthe-counter ADs test to screen for the presence of the HIV virus "Overthe-counter means that the test can be purchased at a pharmacy and used in the privacy of one's own home without having to send anything off to a lab for analysis. (d) Exercise stress testing is sometines used as asoreening tool for Coronary Atery Disease (CAD). () Over the counter pregnancy tests are avalable to quickly test for pregnancy. n The Purfed Protein Dervative (PPD) test is used to screen for tuberculosis. Sometimes this test i also caled the Mantoux best or berculin senstvty test. (0) The Beck Degression inventory is used to screen indviduals for depresskon. PART 2. Analyze a data set Use the data set in the Drections and Evaluation Rubric section for Assessment 3. The data set represents the resuts from patents testing a new version of the screening tool you chose above. You will need to aralyae this patent data to determine the new screening tool is better than the one you chose from above thata cumenty in une. MATH 192K - Aasesamant Guidatres and Scoring Rubrie PART 2: Analyze a data set (continued) Determine two aut-off values for the data trom the new screening tool. Create two-way tables to display your data. Determine the sensitivity and specificity baned on each of the cut-of values you chose. Which cut-off value is better and why? Many people cosider sensitvity and specificity as well as taise discovery and false omission rates when discussing the efectiveness of nion tool Elain he faloa diacovnand folonomisionan Whatod be tnna of pach atea Callate hasa PART 2: Analyze a data set (continued) Determine two cut-off values for the data from the new screening tool. Create two-way tables to display your data. Determine the sensitivity and specificity based on each of the cut-off values you chose. Which cut-off value is better and why? Many people consider sensitivity and specificity as well as false discovery and false omission rates when discussing the effectiveness of a screening tool. Explain the false discovery and false omission rates. What would be the usefulness of each rate? Calculate these two rates for the data from the new screening tool. (Please note: These are NOT the same as false positive or false negative rates. Additional information can be found in the learning resources.) PART 3: Write a professional letter Using your analysis of the data set (from Part 2), write a letter to a doctor explaining your results so the doctor leams more about the new screening tool. Your goal is to convince the doctor to use (or not use) this new screening tool. You will want to compare the results of the data from the new screening tool (Part 2) to the usual results from the screening tool that is now in use (Part 1). Questions to be sure to address: Introduce yourself and the new screening tool. Be sure to include information about what the screening tool is used for as well as the effectiveness of the current version being used today (from Part 1). Don't forget to cite your source(s)! Discuss your analysis. Explain your two cut-off values (from Part 2). along with sensitivity and specificity for each cut-off value. Be sure to explain which cut-off value is better and why. You will need to include ALL calculations and two-way tables with your letter to convince the doctor of your analysis. This may be included within the letter or as an appendix. If you use an appendix, you should reference the appendix within the letter, so your calculation work can be found. Suppose the doctor wanted to choose your OTHER cut-off value. Explain what would happen. In other words: How many healthy patients (without condition) would have been told incorrectly that they may have the condition? How many patients with the condition would have been told incorrectly that they are probably healthy (without condition)? How many patients would have received a correct diagnosis? You will need to include ALL calculations and two-way tables with your letter to convince the doctor of your analysis. This may be included within the letter or as an appendix. If you use an appendix, you should reference the appendix within the letter, so your calculation work can be found. Consider the false discovery and false omission rates (from Part 2) for the new screening tool. Choose one of these to report to the doctor. Be sure to explain what the rate represents, include your rate calculation and explain why this rate supports your opinion of this new screening tool. (Remember to include BOTH rates with your calculations, but you only need to discuss one in the letter itself.) Don't forget to conclude your letter with a positive (or negative) endorsement of the new screening tool! MATH 102X - Assessment 3 Guidelines and Scoring Rubric Your letter does not have to be a certain length, but you do want to make sure it is long enough that you can include all three parts of this project. You will need to include ALL calculations and two-way tables with your letter to convince the doctor of your analysis. This may be included within the letter or as an appendix. If you use an appendix, you should reference the appendix within the letter, so your calculation work can be found. Calculations and tables, included as an appendix, do not need to be in APA or AMA format. However, any work that is not readable cannot be graded. Be sure that all parts of a professional letter are included. Several resources are included in the learning path to help with the format of a professional letter. Jan 19, 2020 at 10:24 AM Kate Childs RT (RI(MI(CT)(BD) 130 Brock Lane Grand Rapids, MN 55744 218-242-3151 kjhoey22@aol.com January 19, 2020 Dr. Who Grand Itasca Clinic & Hospital 1601 Golf Course Road Grand Rapids, MN 55744 Dear Dr. Who: Greetings, I am one of the technologists that work in the Imaging Department. I have been chosen to do research on the new data screening tool that is now available and to compare this to the current exercise stress test screening tool that is in place. Exercise stress testing is sometimes used as a screening tool for Coronary Artery Discase (CAD). It is a procedure where the heart is monitored by an electrocardiograph or (ECG) during an episode that is induced by an increased cardiac demand so areas that are at risk of infarction can be identified. Patients heart rates are increased to 85% of age-predicted maximum target heart rate or until symptoms develop, whatever happens first.' Risk of death and infarction are 1/5000 patients tested. The screening tools sensitivity and specificity are increased when imaging modalities are performed. The current exercise stress testing has 68% sensitivity and a 77% specificity. This requires a normal baseline electrocardiography and isn't recommended in patients with a history of percutancous coronary intervention or coronary artery bypass grafting, however, its less expensive, limited equipment is required with useful prognostic data, and negative predictive value. With Exercise single-photon emission computed tomography, the sensitivity rises to 85%. Specificity increases to 85%. However, heart rhythm irregularities may affect results, soft Page 13 Screening Tool tissue artifacts can happen, and it requires radiation. I obtained this information from two sources. The first being from a comprehensive medical resource filled with a wide range of information called Merck Manuals used for professionals and consumers and updated by recognized medical experts.' The second resource is from a medical journal American Family Physician that is a peer-reviewed and evidence-based clinical journal that is another leading tissue artifacts can happen, and it requires radiation. I obtained this information from two sources. The first being from a comprehensive medical resource filled with a wide range of information called Merck Manuals used for professionals and consumers and updated by recognized medical experts.' The second resource is from a medical journal American Family Physician that is a peer-reviewed and evidence-based clinical journal that is another leading source of medical information. The new screening tool has 54% sensitivity and a 46% specificity, which is significantly lower than the current exercise screening tool in place. The sensitivity or true positive rate of the new screening tool is the probability the screening tool will be correct when CAD is present. The % of patients that received a positive result is 27/50-0.54% x 100%-54%. There is a 54% chance this screening tool will be positive. The specificity is the probability that the screening tool will be correct when CAD is not present. 23 patients without CAD, 23/50-0.46 X 100%-46% specificity. Different populations can produce different results of conditions. New Screening Tool Results Patients being screened % of each total Patient Does have condition 54% sensitivity 27 46% specificity Patient Does NOT have the 23 condition Total 50 Page 14 Screening Tool % Sensitivity Specificity New Tool Pt Does have Patient Total of Value CAD Doesn't have Patients CAD 9% 4 and above 26% Jan 19, 2020 at 10:24 AM Total # of % Sensitivity Specificity New Tool Pt Does have Patient Value CAD Doesn't have Patients CAD 26% 4 and above 3.9 to 2.1 14 18% 39% 2.0 to 1.1 15% 26% 10