

Question: I need to create on MATLAB 2) Write a function m-file to calculate and plot the bifurcation diagram for the logistic map: The inputs will
I need to create on MATLAB
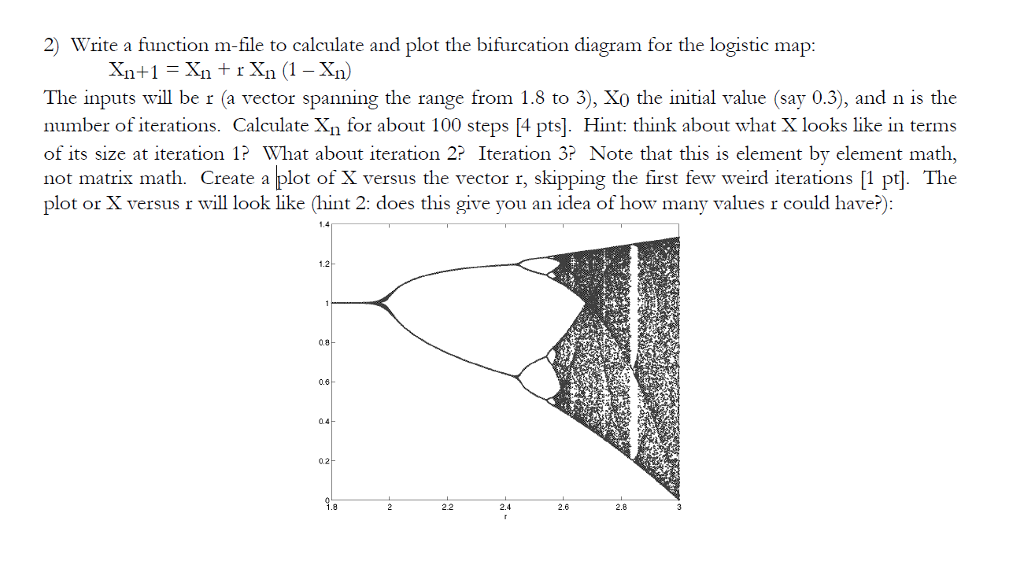
2) Write a function m-file to calculate and plot the bifurcation diagram for the logistic map: The inputs will be r (a vector spanning the range from 1.8 to 3), Xo the initial value (say 0.3), and n is the number of iterations. Calclate Xn for about 100 steps [4 pts]. Hint: think about what X looks like in terms of its size at iteration 1P What about iteration 2? Iteration 3? Note that this is element by element math, not matrix math. Create a plot of X versus the vector r, skipping the first few weird iterations [1 pt]. The plot or X versus r will look like (hint 2: does this give you an idea of how many values r could have?): 1.2 08 0.6 0.4 0.2 2.2 2.8
Step by Step Solution
There are 3 Steps involved in it

Get step-by-step solutions from verified subject matter experts