

Question: I need to do a one year financial model for Reed Supermarket Case study. the appropriate flow for the story and recommendation that you are
I need to do a one year financial model for Reed Supermarket Case study.
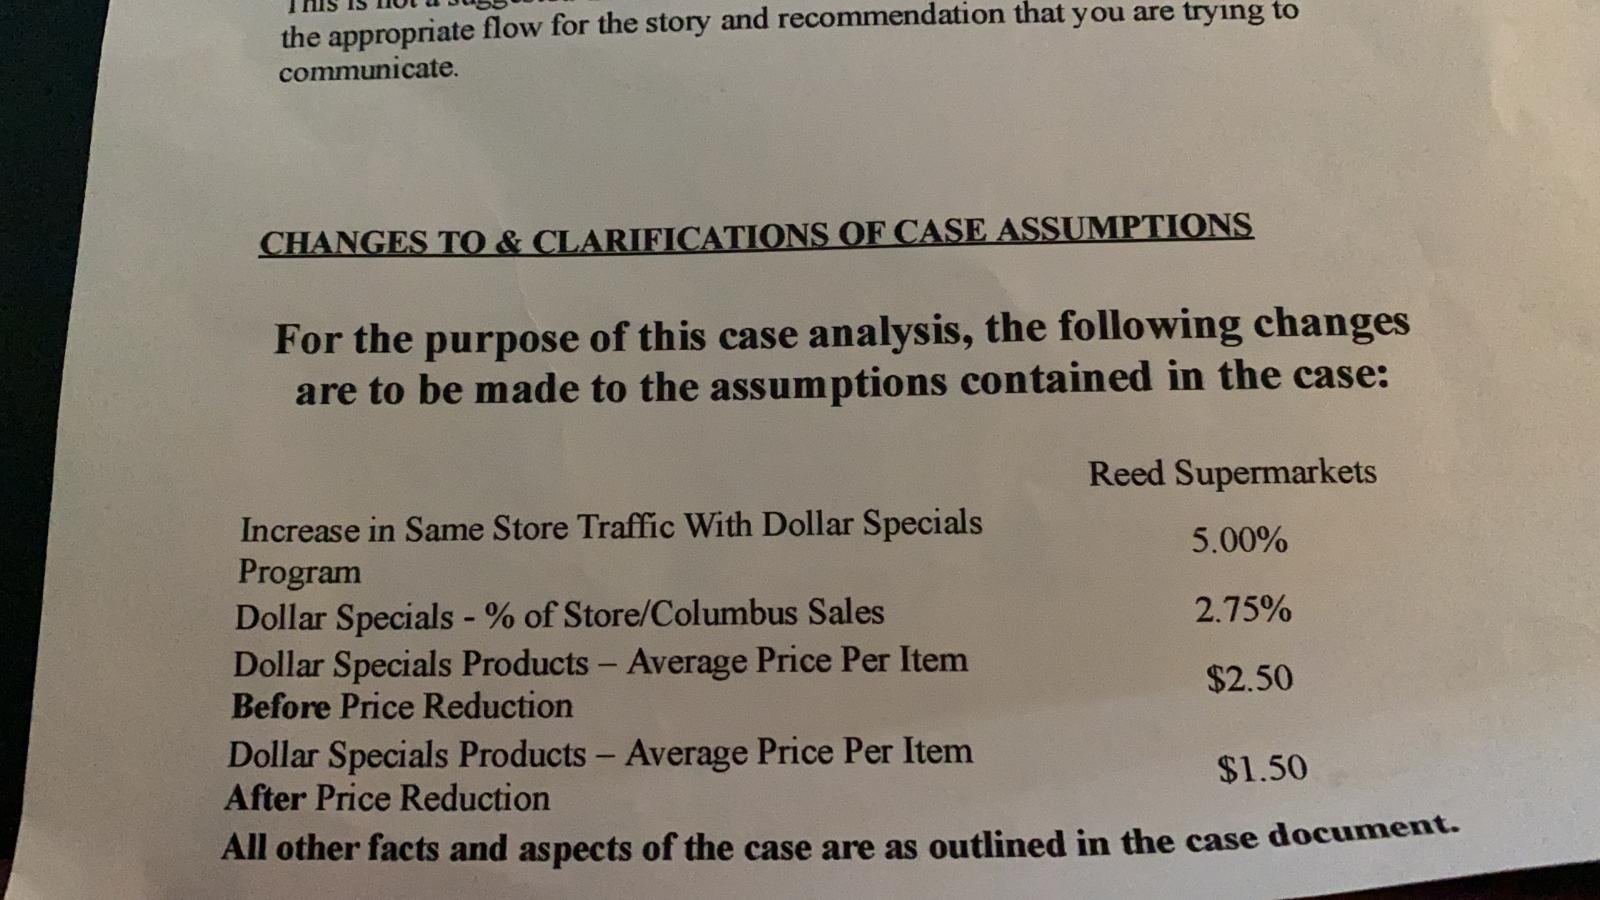
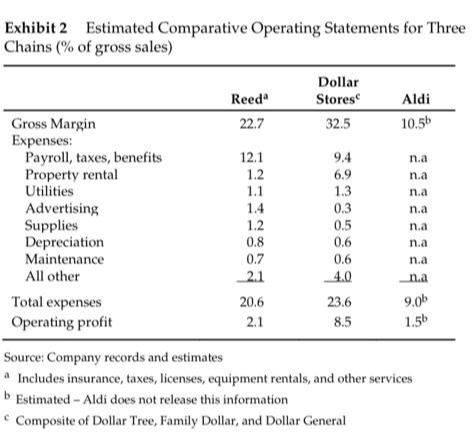
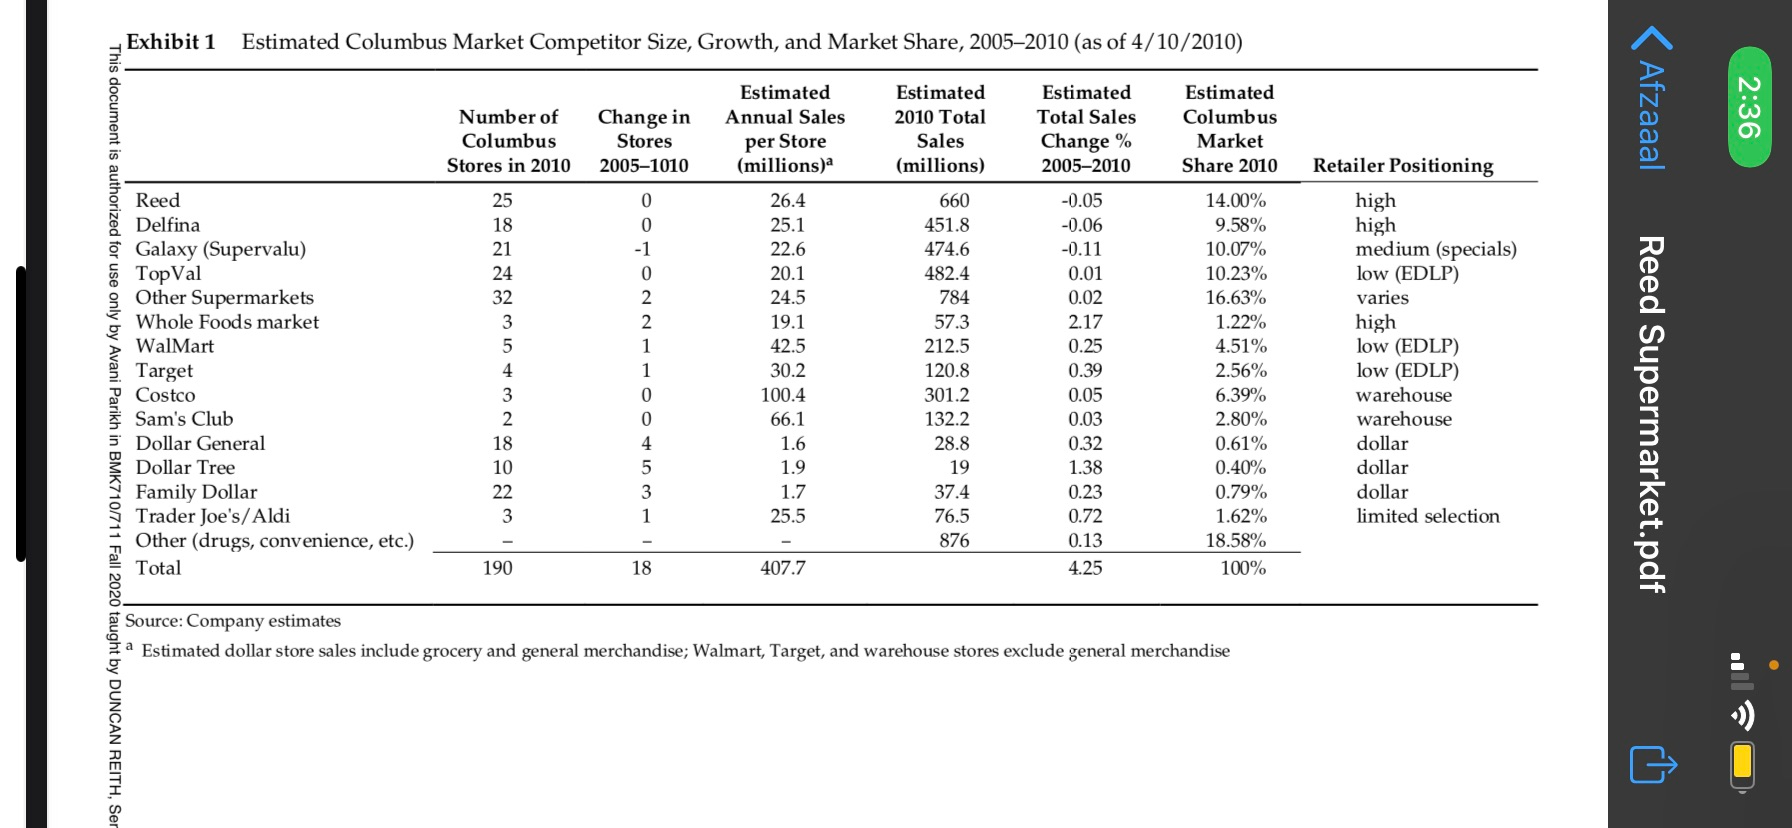
the appropriate flow for the story and recommendation that you are trying to communicate. CHANGES TO & CLARIFICATIONS OF CASE ASSUMPTIONS For the purpose of this case analysis, the following changes are to be made to the assumptions contained in the case: Reed Supermarkets Increase in Same Store Traffic With Dollar Specials 5.00% Program Dollar Specials - % of Store/Columbus Sales 2.75% Dollar Specials Products - Average Price Per Item $2.50 Before Price Reduction Dollar Specials Products - Average Price Per Item $1.50 After Price Reduction All other facts and aspects of the case are as outlined in the case document. Exhibit 2 Estimated Comparative Operating Statements for Three Chains (% of gross sales) Dollar Stores Reed Aldi 22.7 32.5 10.56 12.1 1.2 1.1 1.4 1.2 9.4 6.9 1.3 n.a n.a n.a Gross Margin Expenses: Payroll, taxes, benefits Property rental Utilities Advertising Supplies Depreciation Maintenance All other Total expenses Operating profit 0.3 n.a n.a n.a n.a 0.8 0.5 0.6 0.6 4.0 23.6 8.5 0.7 2.1 20.6 2.1 na 9.00 1.56 Source: Company records and estimates Includes insurance, taxes, licenses, equipment rentals, and other services Estimated - Aldi does not release this information Composite of Dollar Tree, Family Dollar, and Dollar General Exhibit 1 Estimated Columbus Market Competitor Size, Growth, and Market Share, 20052010 (as of 4/10/2010) Number of Columbus Stores in 2010 Estimated Annual Sales per Store (millions) Change in Stores 2005-1010 Estimated 2010 Total Sales (millions) Estimated Total Sales Change % 2005-2010 Estimated Columbus Market Share 2010 2:36 Afzaaal This document is authorized for use only by Avani Parikh in BMK710/711 Fall 2020 taught by DUNCAN REITH, Ser Reed Delfina Galaxy (Supervalu) TopVal Other Supermarkets Whole Foods market WalMart Target Costco Sam's Club Dollar General Dollar Tree Family Dollar Trader Joe's/ Aldi Other (drugs, convenience, etc.) Total 25 18 21 24 32 3 5 4 3 2 18 10 22 3 0 0 - 1 0 2 2 1 1 0 0 4 5 3 1 26.4 25.1 22.6 20.1 24.5 19.1 42.5 30.2 100.4 66.1 1.6 1.9 1.7 25.5 660 451.8 474.6 482.4 784 57.3 212.5 120.8 301.2 132.2 28.8 19 37.4 76.5 876 -0.05 -0.06 -0.11 0.01 0.02 2.17 0.25 0.39 0.05 0.03 0.32 1.38 0.23 14.00% 9.58% 10.07% 10.23% 16.63% 1.22% 4.51% 2.56% 6.39% 2.80% 0.61% 0.40% 0.79% 1.62% 18.58% 100% Retailer Positioning high high medium (specials) low (EDLP) varies high low (EDLP) low (EDLP) warehouse warehouse dollar dollar dollar limited selection Reed Supermarket.pdf 0.72 0.13 4.25 190 18 407.7 Source: Company estimates a Estimated dollar store sales include grocery and general merchandise; Walmart, Target, and warehouse stores exclude general merchandise the appropriate flow for the story and recommendation that you are trying to communicate. CHANGES TO & CLARIFICATIONS OF CASE ASSUMPTIONS For the purpose of this case analysis, the following changes are to be made to the assumptions contained in the case: Reed Supermarkets Increase in Same Store Traffic With Dollar Specials 5.00% Program Dollar Specials - % of Store/Columbus Sales 2.75% Dollar Specials Products - Average Price Per Item $2.50 Before Price Reduction Dollar Specials Products - Average Price Per Item $1.50 After Price Reduction All other facts and aspects of the case are as outlined in the case document. Exhibit 2 Estimated Comparative Operating Statements for Three Chains (% of gross sales) Dollar Stores Reed Aldi 22.7 32.5 10.56 12.1 1.2 1.1 1.4 1.2 9.4 6.9 1.3 n.a n.a n.a Gross Margin Expenses: Payroll, taxes, benefits Property rental Utilities Advertising Supplies Depreciation Maintenance All other Total expenses Operating profit 0.3 n.a n.a n.a n.a 0.8 0.5 0.6 0.6 4.0 23.6 8.5 0.7 2.1 20.6 2.1 na 9.00 1.56 Source: Company records and estimates Includes insurance, taxes, licenses, equipment rentals, and other services Estimated - Aldi does not release this information Composite of Dollar Tree, Family Dollar, and Dollar General Exhibit 1 Estimated Columbus Market Competitor Size, Growth, and Market Share, 20052010 (as of 4/10/2010) Number of Columbus Stores in 2010 Estimated Annual Sales per Store (millions) Change in Stores 2005-1010 Estimated 2010 Total Sales (millions) Estimated Total Sales Change % 2005-2010 Estimated Columbus Market Share 2010 2:36 Afzaaal This document is authorized for use only by Avani Parikh in BMK710/711 Fall 2020 taught by DUNCAN REITH, Ser Reed Delfina Galaxy (Supervalu) TopVal Other Supermarkets Whole Foods market WalMart Target Costco Sam's Club Dollar General Dollar Tree Family Dollar Trader Joe's/ Aldi Other (drugs, convenience, etc.) Total 25 18 21 24 32 3 5 4 3 2 18 10 22 3 0 0 - 1 0 2 2 1 1 0 0 4 5 3 1 26.4 25.1 22.6 20.1 24.5 19.1 42.5 30.2 100.4 66.1 1.6 1.9 1.7 25.5 660 451.8 474.6 482.4 784 57.3 212.5 120.8 301.2 132.2 28.8 19 37.4 76.5 876 -0.05 -0.06 -0.11 0.01 0.02 2.17 0.25 0.39 0.05 0.03 0.32 1.38 0.23 14.00% 9.58% 10.07% 10.23% 16.63% 1.22% 4.51% 2.56% 6.39% 2.80% 0.61% 0.40% 0.79% 1.62% 18.58% 100% Retailer Positioning high high medium (specials) low (EDLP) varies high low (EDLP) low (EDLP) warehouse warehouse dollar dollar dollar limited selection Reed Supermarket.pdf 0.72 0.13 4.25 190 18 407.7 Source: Company estimates a Estimated dollar store sales include grocery and general merchandise; Walmart, Target, and warehouse stores exclude general merchandise
Step by Step Solution
There are 3 Steps involved in it

Get step-by-step solutions from verified subject matter experts