

Question: I need to do a time series analysis for fund raising $30 million for this fiscal year 2023 and a linear regression between efforts and
I need to do a time series analysis for fund raising $30 million for this fiscal year 2023 and a linear regression between efforts and giving with a Giving confidence level of 95%
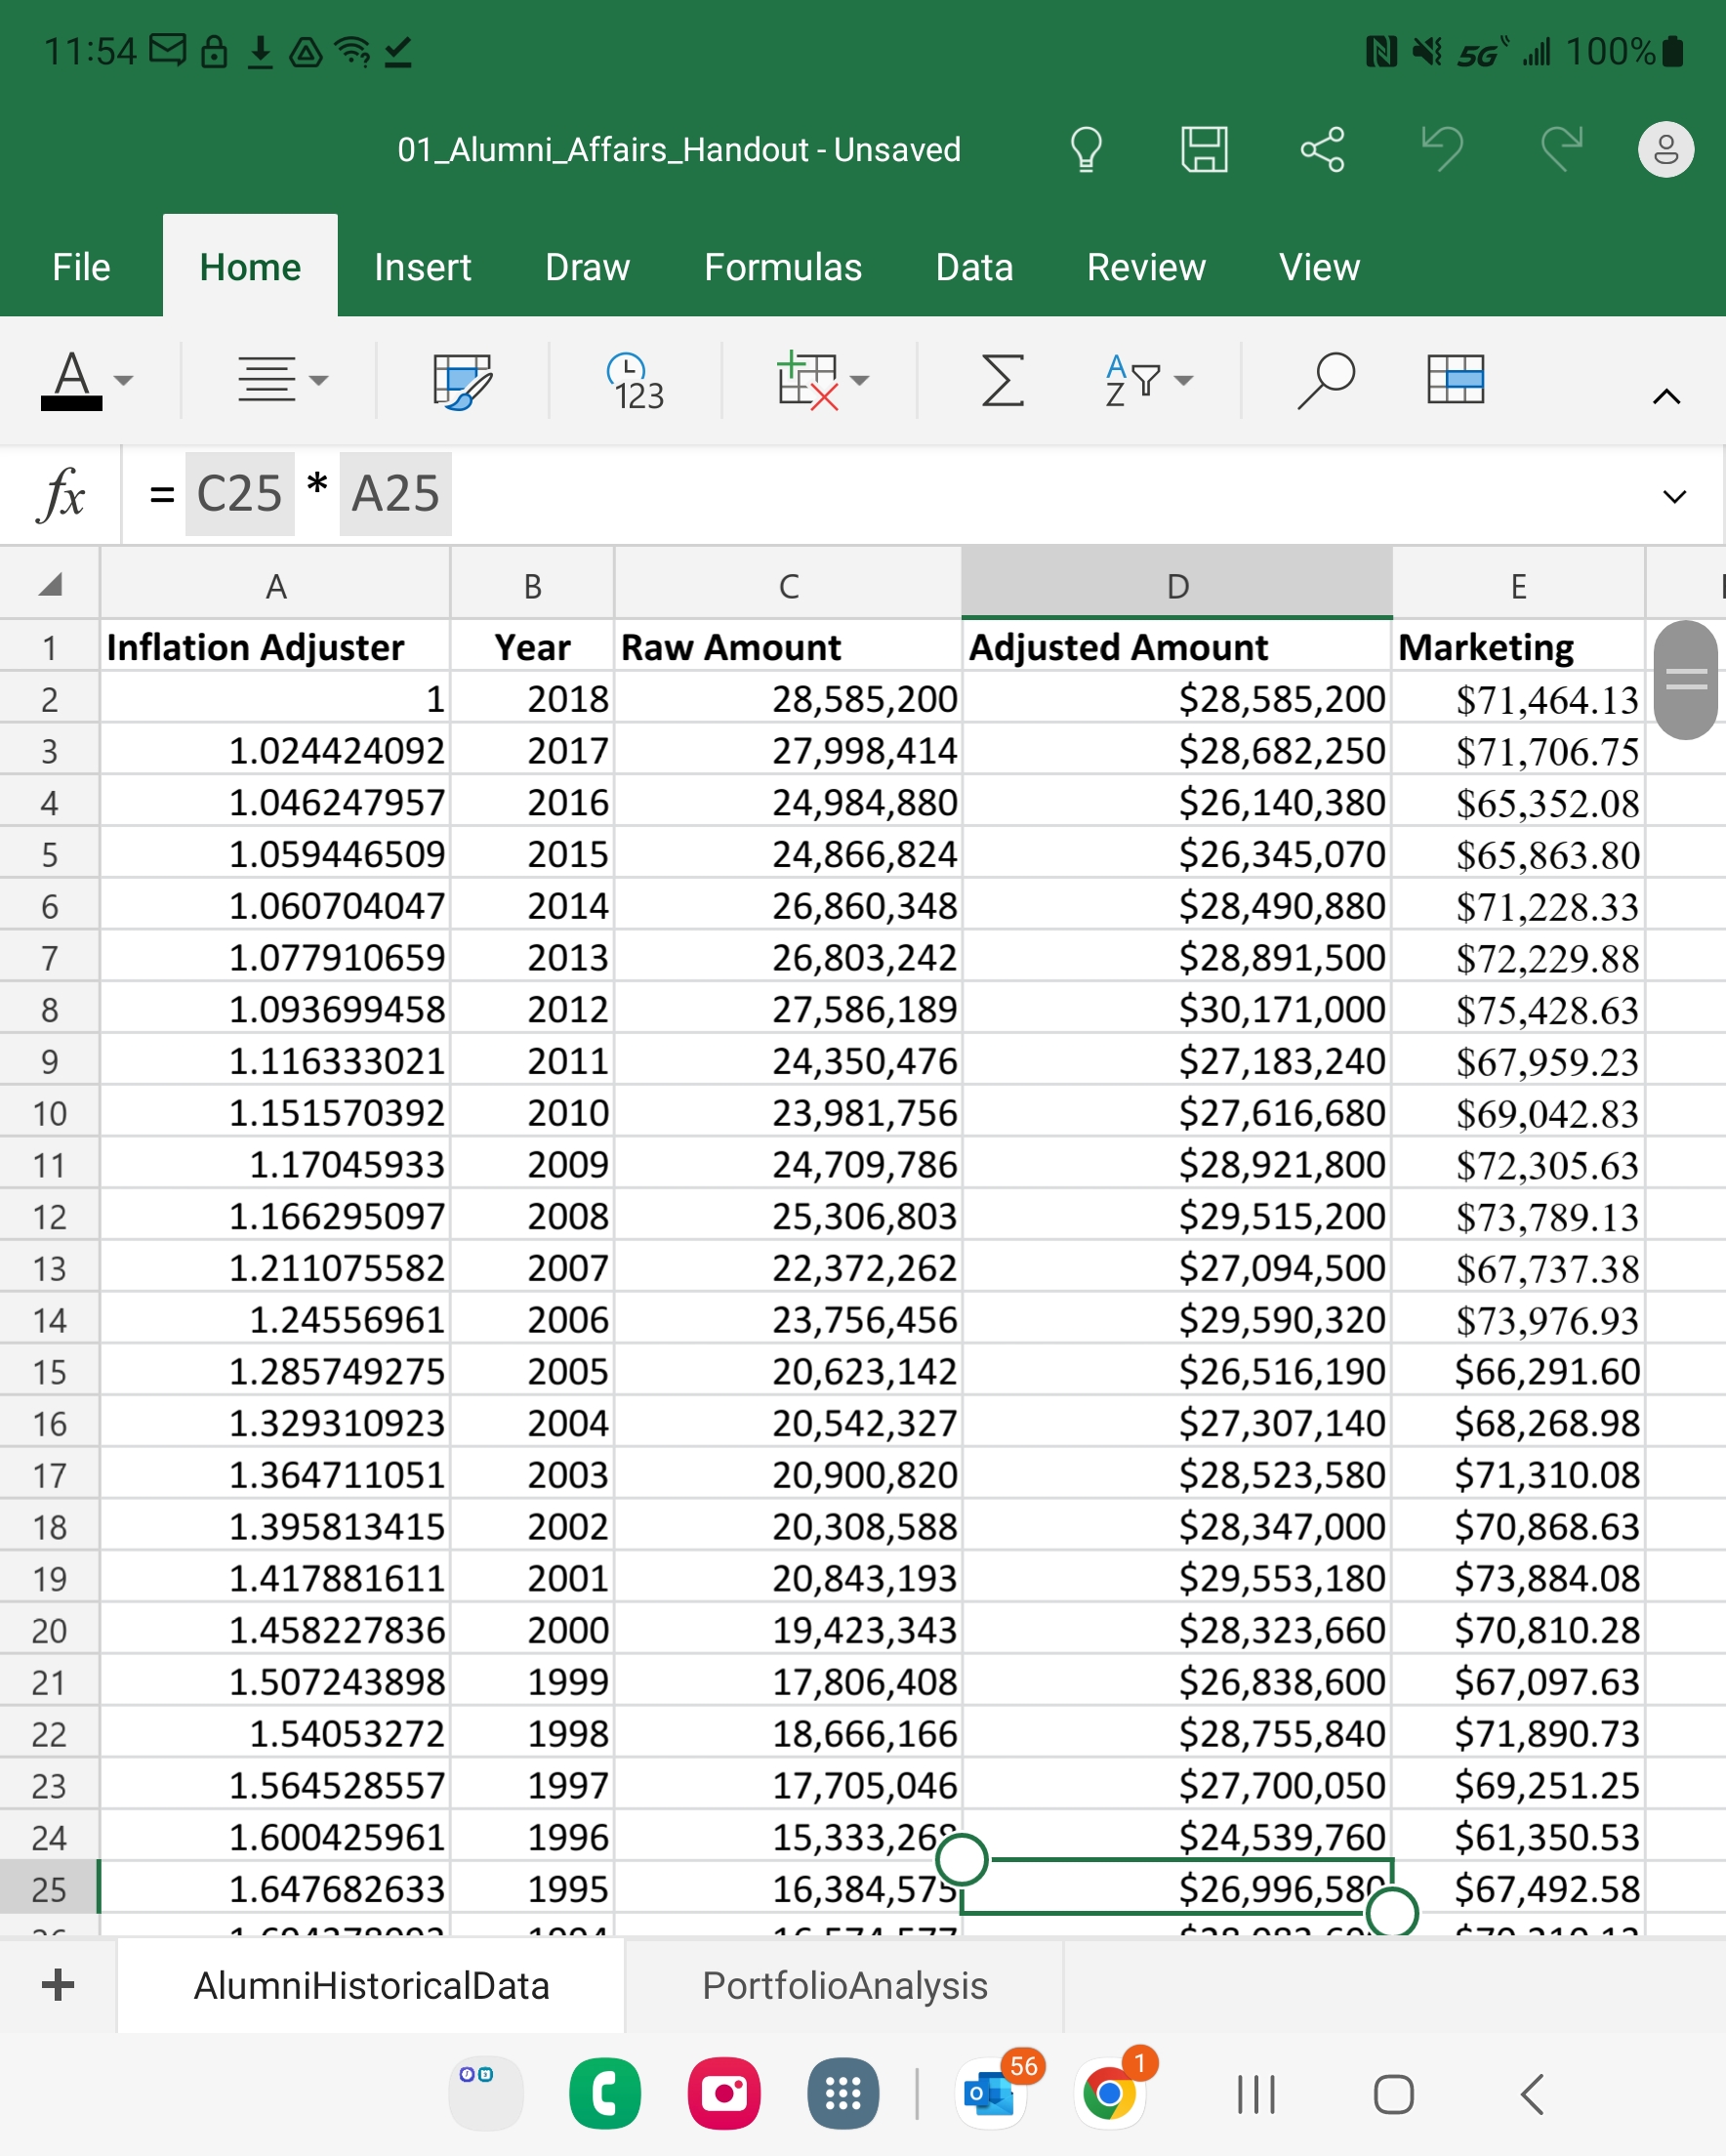
11:54 8 141 IN * 5G all 100% 01_Alumni_Affairs_Handout - Unsaved H File Home Insert Draw Formulas Data Review View 123 fx = C25 * A25 A B C D E 1 Inflation Adjuster Year Raw Amount Adjusted Amount Marketing 1 2018 28,585,200 $28,585,200 $71,464.13 A W N 1.024424092 2017 27,998,414 $28,682,250 $71,706.75 1.046247957 2016 24,984,880 $26,140,380 $65,352.08 1.059446509 2015 24,866,824 $26,345,070 O UT $65,863.80 1.060704047 2014 26,860,348 $28,490,880 $71,228.33 1.077910659 2013 26,803,242 $28,891,500 $72,229.88 1.093699458 2012 27,586,189 $30,171,000 $75,428.63 9 1.116333021 2011 24,350,476 $27,183,240 $67,959.23 10 1.151570392 2010 23,981,756 $27,616,680 $69,042.83 11 1.17045933 2009 24,709,786 $28,921,800 $72,305.63 12 1.166295097 2008 25,306,803 $29,515,200 $73, 789.13 13 1.211075582 2007 22,372,262 $27,094,500 $67,737.38 14 1.24556961 2006 23,756,456 $29,590,320 $73,976.93 15 1.285749275 2005 20,623,142 $26,516,190 $66,291.60 16 1.329310923 2004 20,542,327 $27,307,140 $68,268.98 17 1.364711051 2003 20,900,820 $28,523,580 $71,310.08 18 1.395813415 2002 20,308,588 $28,347,000 $70,868.63 19 1.417881611 2001 20,843,193 $29,553,180 $73,884.08 20 1.458227836 2000 19,423,343 $28,323,660 $70,810.28 21 1.507243898 1999 17,806,408 $26,838,600 $67,097.63 22 1.54053272 1998 18,666,166 $28,755,840 $71,890.73 23 1.564528557 1997 17,705,046 $27,700,050 $69,251.25 24 1.600425961 1996 15,333,262 $24,539,760 $61,350.53 25 1.647682633 1995 16,384,575 $26,996,580 $67,492.58 AlumniHistoricalData PortfolioAnalysis 56 111 O
Step by Step Solution
There are 3 Steps involved in it

Get step-by-step solutions from verified subject matter experts