

Question: I need to do this on MATLAB 5) Non-linear least squares regression: Variograms are closely related to correlation functions, and are used for characterizing spatial
I need to do this on MATLAB
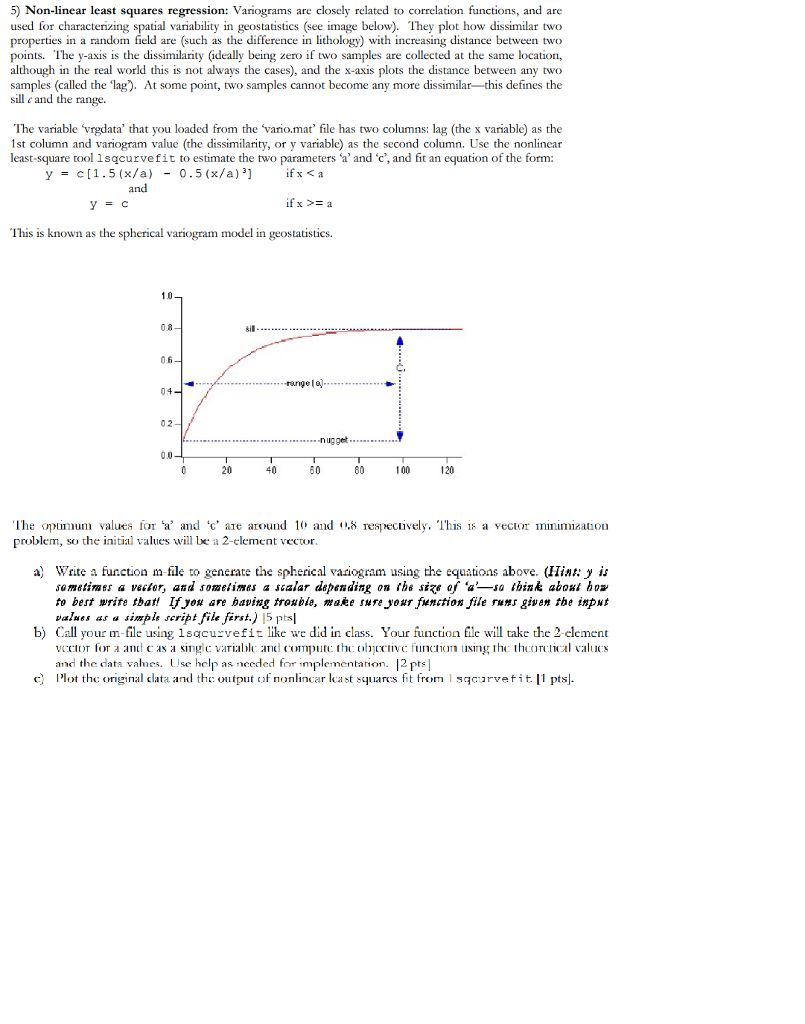
5) Non-linear least squares regression: Variograms are closely related to correlation functions, and are used for characterizing spatial variability in geostatistics (see image below). They plot how dissimilar two properties in a random field are (such as the difference in lithology) with increasing distance between two points. The y-axis is the dissimilarity (ideally being zero if two samples are collected at the same location, although in the real world this is not always the cases), and the x-axis plots the distance between any two samples (called the 'lag) At some point, two samples cannot become any more dissimilar this defines the sill e and the range. The variable 'vrgdata' that you loaded from the vario.mat' file has two columns: lag (the x variable) as the 1st column and variogram value (the dissimilarity, or y variable) as the second column. Use the nonlinear least-square tool 1sqcurvefit to estimate the two param eters a' and 'c', and fit an equation of the form: y=c[1.5(x/a) and -0.5(x/a))] if x
Step by Step Solution
There are 3 Steps involved in it
To complete this task in MATLAB follow the steps outlined for parts a b and c Below is the complete ... View full answer

Get step-by-step solutions from verified subject matter experts