

Question: I need to explain the dependent variable (BMI) with using the 2 graphs. The explanation needs to include reasons for statistics. II. [30 points] Present
I need to explain the dependent variable (BMI) with using the 2 graphs. The explanation needs to include reasons for statistics.
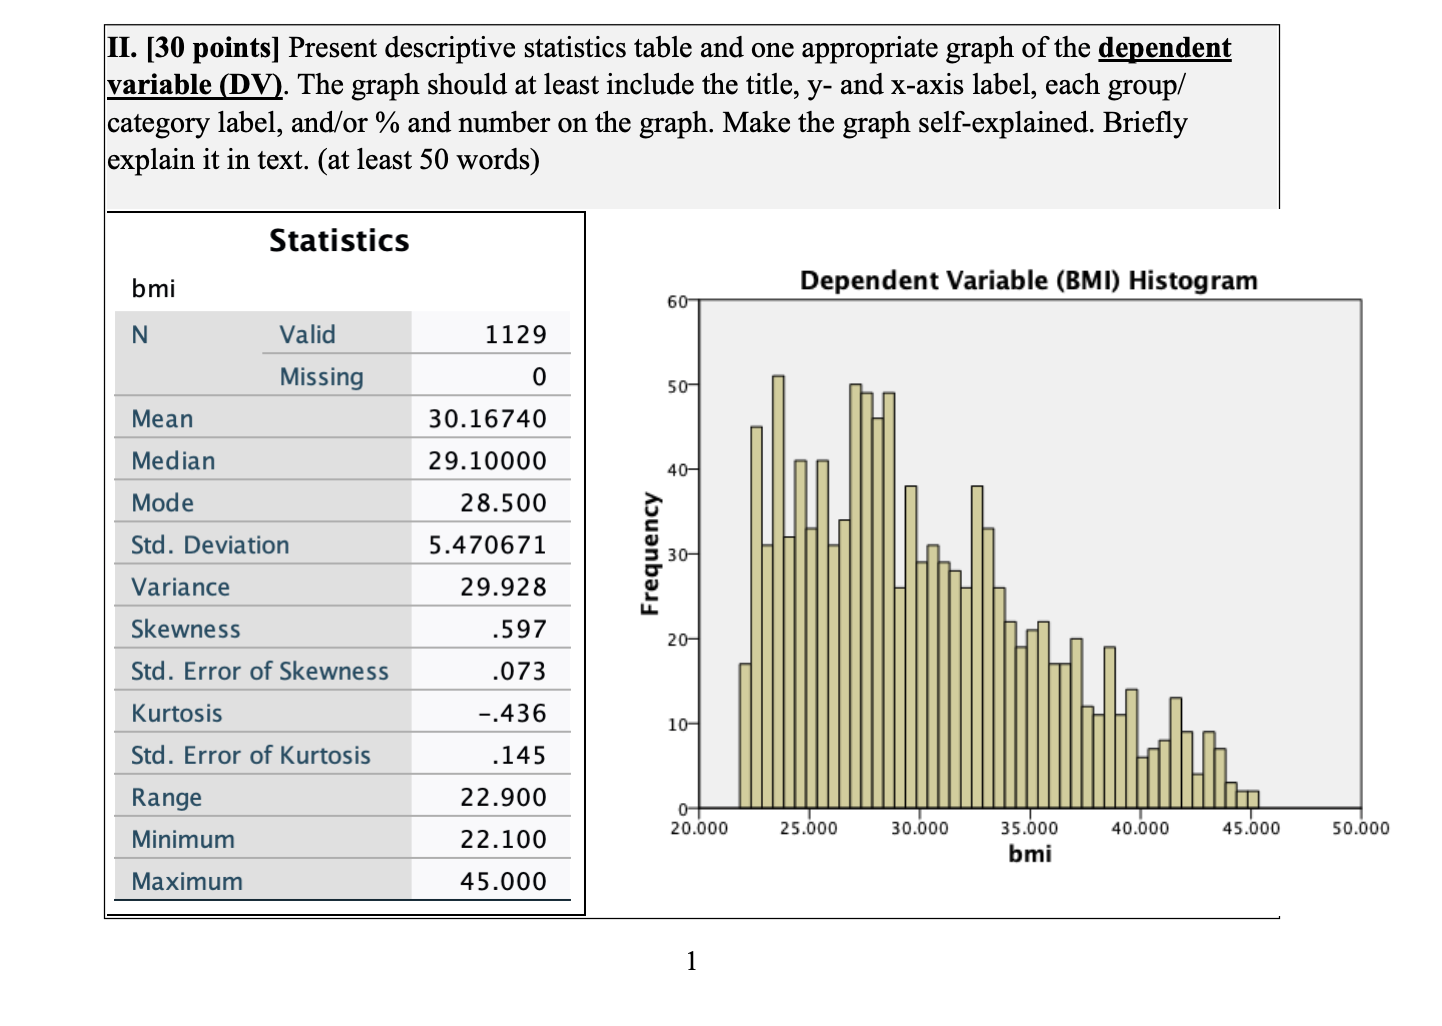
II. [30 points] Present descriptive statistics table and one appropriate graph of the dependent variable [9! 1. The graph should at least include the title, y- and x-axis label, each group/ category label, and/or % and number on the graph. Make the graph self-explained. Briey explain it in text. (at least 50 words) Statistics bmi 6 Dependent Variable (BM I) Histogram N Valid 1 129 Missing 0 Mean 30. 16740 Median 29.10000 Mode 28.500 Std. Deviation 5.470671 Variance 29.928 Skewness .597 Std. Error of Skewness .073 Kurtosis -.436 Std. Error of Kurtosis .145 Range 22.900 Minimum 2 2 - 1 00 25.000 30.000 33:: 40.000 45.000 Maximum 45.000 50 .000
Step by Step Solution
There are 3 Steps involved in it

Get step-by-step solutions from verified subject matter experts