

Question: I need to find the test statistic, p value and what the box plot will look like. Please help. A researcher studies water clarity at
I need to find the test statistic, p value and what the box plot will look like. Please help.
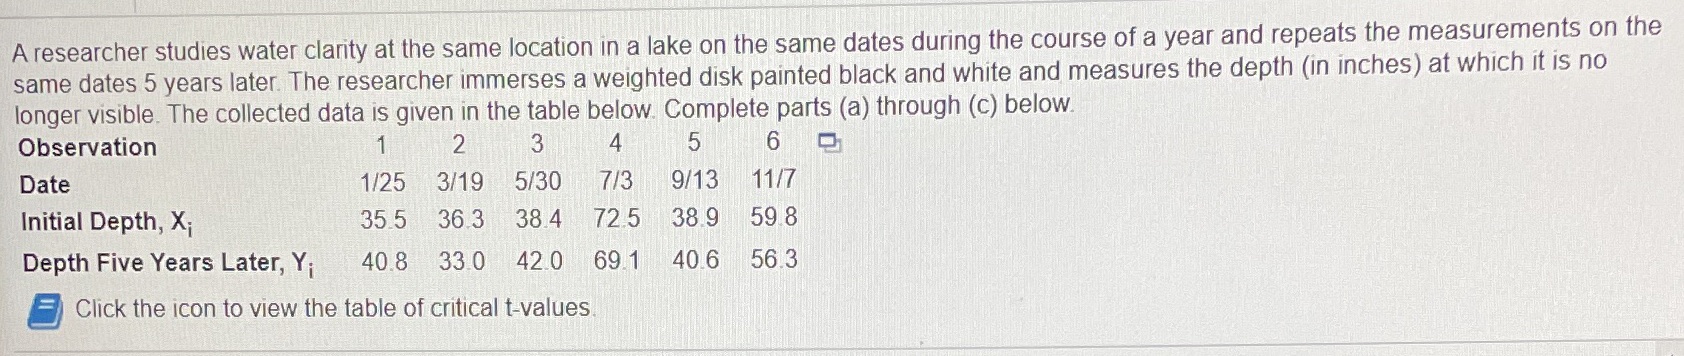
A researcher studies water clarity at the same location in a lake on the same dates during the course of a year and repeats the measurements on the same dates 5 years later. The researcher immerses a weighted disk painted black and white and measures the depth (in inches) at which it is no longer visible. The collected data is given in the table below. Complete parts (a) through (c) below. Observation 2 3 4 5 6 Date 1/25 3/19 5/30 7/3 9/13 11/7 Initial Depth, X; 35 5 36 3 384 725 38.9 598 Depth Five Years Later, Y; 40.8 330 420 69 1 406 56.3 Click the icon to view the table of critical t-values
Step by Step Solution
There are 3 Steps involved in it

Get step-by-step solutions from verified subject matter experts