

Question: I need to get this questions done using the excel in the picture A) show sales (totalcharge) by year and by store, (Hint: to get
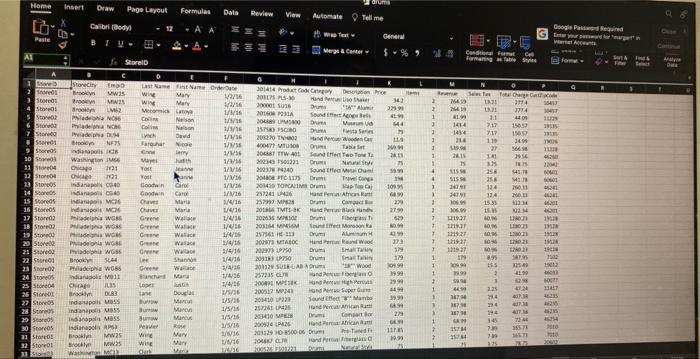
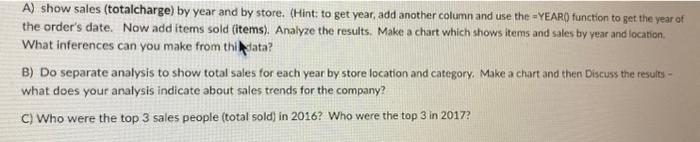
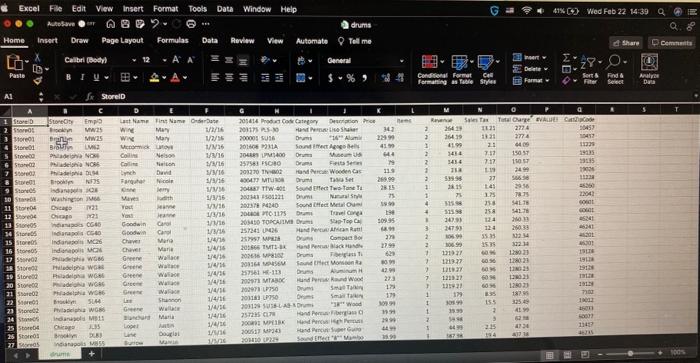
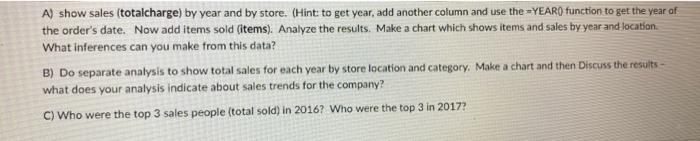
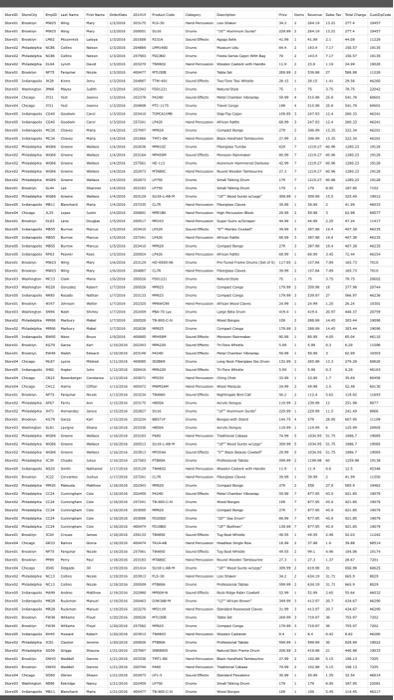
A) show sales (totalcharge) by year and by store, (Hint: to get year, add another column and use the = YEAR() function to get the year of the order's date. Now add items sold (items). Analyze the results. Make a chart which shows items and sales by year and location. What inferences can you make from thilsata? B) Do separate analysis to show total sales for each year by store location and category. Make a chart and then Discuss the resuits what does your analysis indicate about sales trends for the company? C) Who were the top 3 sales people (total sold) in 2016? Who were the top 3 in 2017 ? A) show sales (totalcharge) by year and by store. (Hint: to get year, add another column and use the =YEAR0 function to get the year of the order's date. Now add items sold (items). Analyze the results. Make a chart which shows items and sales by year and location. What inferences can you make from this data? B) Do separate analysis to show total sales for each year by store location and category. Make a chart and then Discuss the results what does your analysis indicate about sales trends for the company? C) Who were the top 3 sales people (total sold) in 2016? Who were the top 3 in 2017 ? 11111111111111111111111111111111111111111111111111111111111111 111111111131111111111111111111111111111111111111111,1111111111111 [11111111111111111111111111111111111111111111111111111111111111
Step by Step Solution
There are 3 Steps involved in it

Get step-by-step solutions from verified subject matter experts