

Question: I need to graph this answer, but don't know how to solve for the lines. I appreciate the help! Operational Information for Flute Co. Selling
 I need to graph this answer, but don't know how to solve for the lines. I appreciate the help!
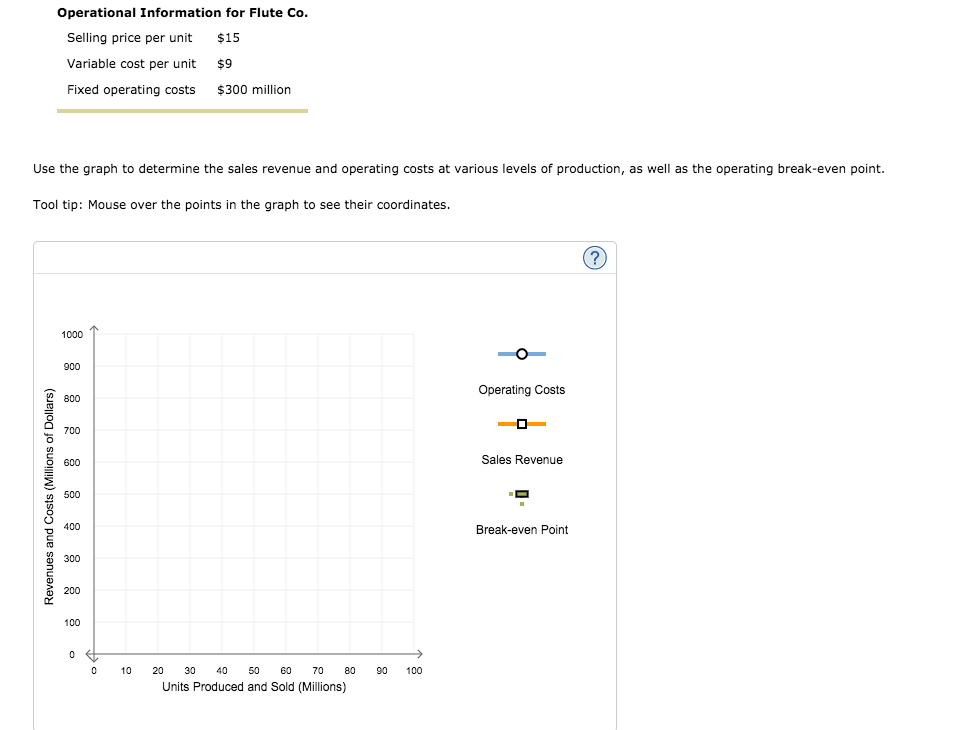
Operational Information for Flute Co. Selling price per unit $15 Variable cost per unit $9 Fixed operating costs $ 300 million Use the graph to determine the sales revenue and operating costs at various levels of production, as well as the operating break-even point. Tool tip: Mouse over the points in the graph to see their coordinates. ? 1000 900 Operating costs 800 700 600 Sales Revenue Revenues and Costs (Millions of Dollars) 500 400 Break-even Point 300 200 100 OCH 0 10 90 100 20 30 40 50 60 70 80 Units Produced and Sold (Millions) Operational Information for Flute Co. Selling price per unit $15 Variable cost per unit $9 Fixed operating costs $ 300 million Use the graph to determine the sales revenue and operating costs at various levels of production, as well as the operating break-even point. Tool tip: Mouse over the points in the graph to see their coordinates. ? 1000 900 Operating costs 800 700 600 Sales Revenue Revenues and Costs (Millions of Dollars) 500 400 Break-even Point 300 200 100 OCH 0 10 90 100 20 30 40 50 60 70 80 Units Produced and Sold (Millions)
Step by Step Solution
There are 3 Steps involved in it

Get step-by-step solutions from verified subject matter experts