

Question: i need to know how to solve for the standard deviation and the other questions in this pictures thank u This Question: 9 pts 3
i need to know how to solve for the standard deviation and the other questions in this pictures thank u
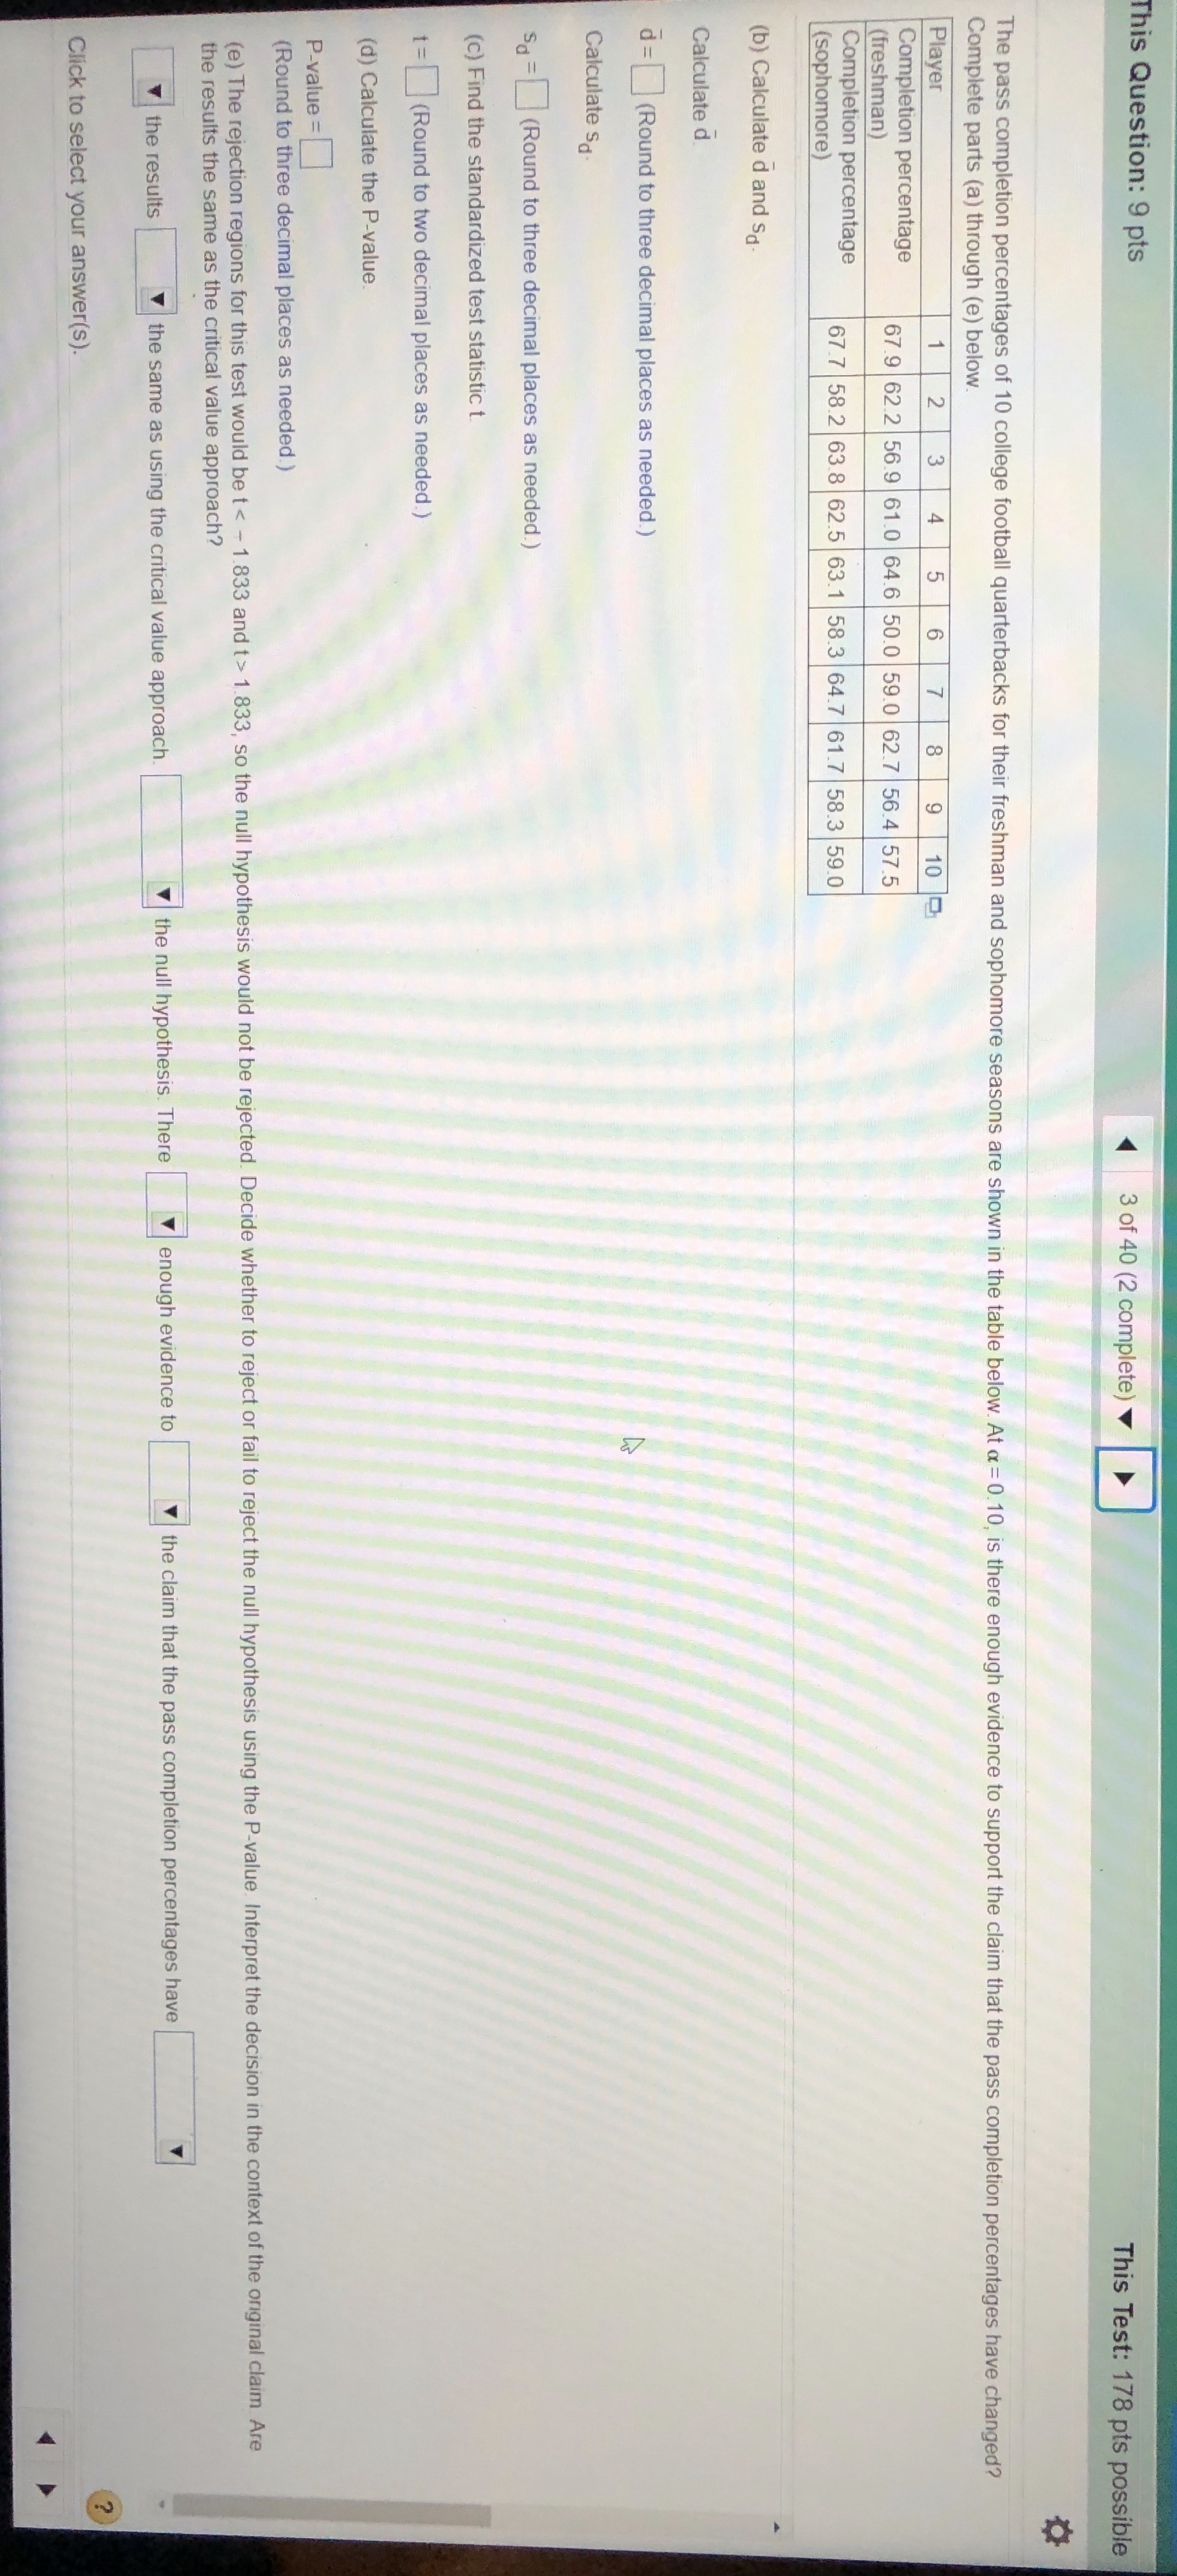
This Question: 9 pts 3 of 40 (2 complete) A This Test: 178 pts possible The pass completion percentages of 10 college football quarterbacks for their freshman and sophomore seasons are shown in the table below. At a = 0.10, is there enough evidence to support the claim that the pass completion percentages have changed? Complete parts (a) through (e) below. Player 2 3 4 5 6 8 9 10 Completion percentage (freshman) 67.9 62.2 56.9 61 0 64.6 50.0 59.0 62.7 56.4 57.5 Completion percentage (sophomore) 67 7 58.2 63.8 62.5 63.1 58.3 64.7 61.7 58.3 59.0 (b ) Calculate d and Sd . Calculate d a =(Round to three decimal places as needed.) Calculate S Sa = ( Round to three decimal places as needed.) (c) Find the standardized test statistic t. 1 =(Round to two decimal places as needed. ) (d) Calculate the P-value. P-value =] (Round to three decimal places as needed. ) (e) The rejection regions for this test would be t 1.833, so the null hypothesis would not be rejected. Decide whether to reject or fail to reject the null hypothesis using the P-value. Interpret the decision in the context of the original claim Are the results the same as the critical value approach? the results the same as using the critical value approach. the null hypothesis. There enough evidence to the claim that the pass completion percentages have Click to select your answer (s)
Step by Step Solution
There are 3 Steps involved in it

Get step-by-step solutions from verified subject matter experts